Valuation – S&P 500 NTM P/E

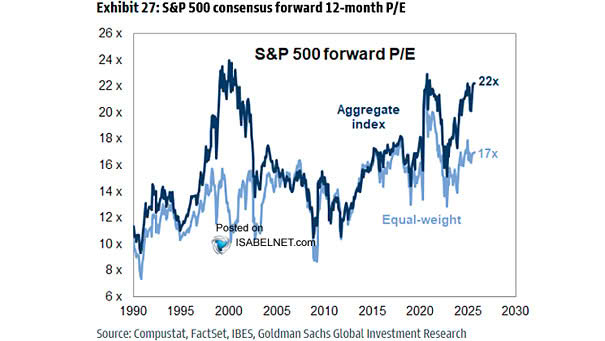
Valuation – S&P 500 NTM P/E The equal-weight index trades at 15 times forward earnings, compared with 19 for the benchmark. It’s not cheap, but the valuation gap offers investors a more attractive entry point. Image: Goldman Sachs Global Investment Research
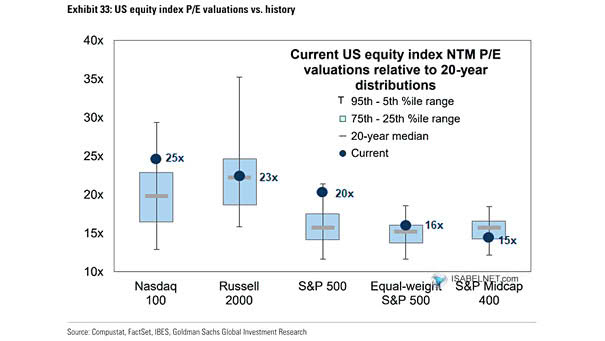
U.S. Equity Index P/E Valuations vs. History

U.S. Equity Index P/E Valuations vs. History U.S. stocks are expensive, but investors are buying anyway: the Nasdaq 100 trades at 23 times forward earnings, the Russell 2000 at 22 times and the S&P 500 at 19 times.. Image: Goldman Sachs Global Investment Research
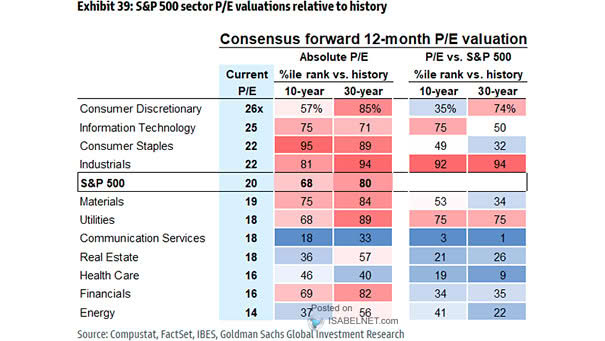
S&P 500 Sector P/E Valuations Relative to History

S&P 500 Sector P/E Valuations Relative to History Energy still looks cheap, while Industrials, Healthcare, and Consumer Staples have less room for disappointment. Image: Goldman Sachs Global Investment Research

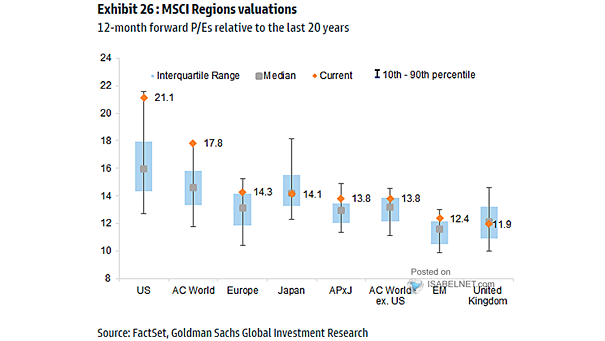
Valuations – 12-Month Forward P/E Ranges (MSCI Regions)

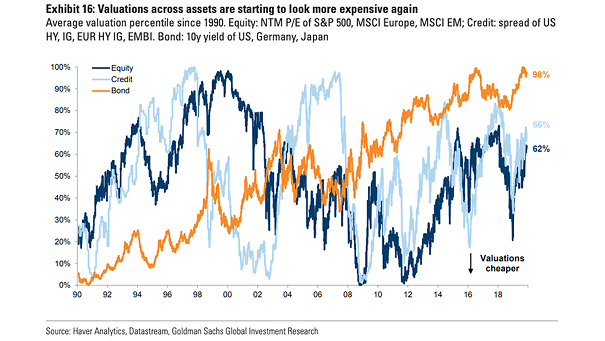
Valuations – 12-Month Forward P/E Ranges (MSCI Regions) U.S. and global stocks still look expensive, but earnings are growing fast enough to support those valuations. As long as profits keep beating expectations, the premium is the price of admission, not a reason to sell. Image: Goldman Sachs Global Investment Research
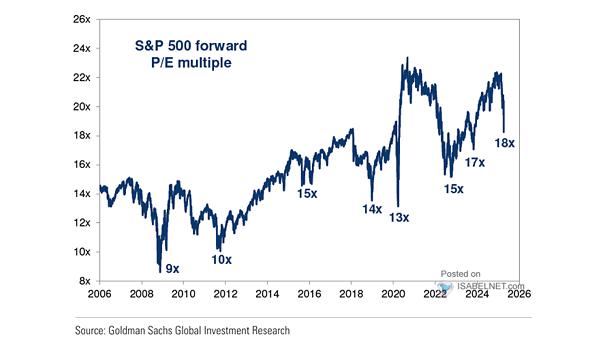
Valuation – S&P 500 Forward P/E Multiple

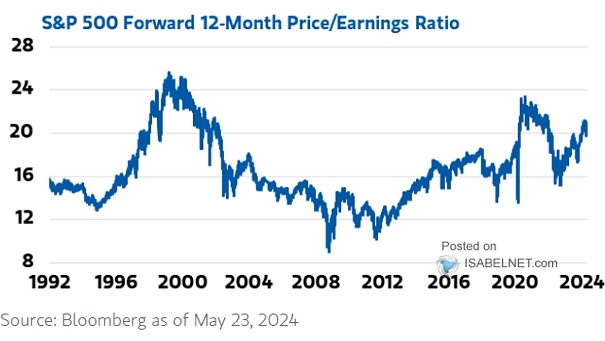
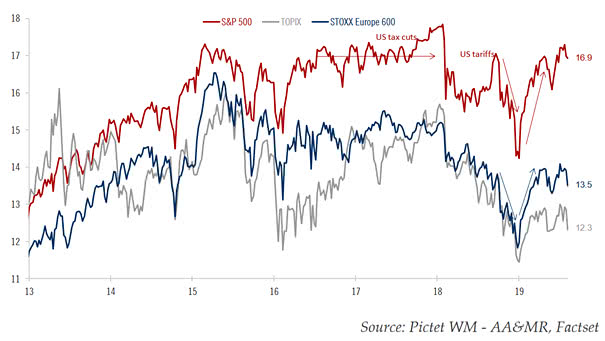
Valuation – S&P 500 Forward P/E Multiple Since October 2025, the S&P 500’s forward P/E has compressed from 23 to 19, not because prices fell but because earnings estimates rose. Valuations have cooled from their highs, but stocks are still far from a bargain. Image: Goldman Sachs Global Investment Research
Valuation – Hyperscaler Forward P/E

Valuation – Hyperscaler Forward P/E Valuations for the hyperscalers have come down meaningfully from their peak and now sit at their lowest level in 10 years. They’re still not a bargain, but the risk‑reward looks much more balanced. Image: Goldman Sachs Global Investment Research
U.S. Equity Valuation Metrics (Z-Score Since 1900)

U.S. Equity Valuation Metrics (Z-Score Since 1900) U.S. equities look expensive by almost any historical measure, with most valuation metrics more than two standard deviations above their long-term averages. But if momentum holds, the rally may have further to run. Image: The Daily Shot

Valuation Percentile – Shiller P/E and U.S. 10-Year Yield

Valuation Percentile – Shiller P/E and U.S. 10-Year Yield The Shiller P/E says US equities are expensive. The 10‑year U.S. Treasury yield, by comparison, is back around its historical average. Is it time to favor bonds over equities? Image: Goldman Sachs Global Investment Research