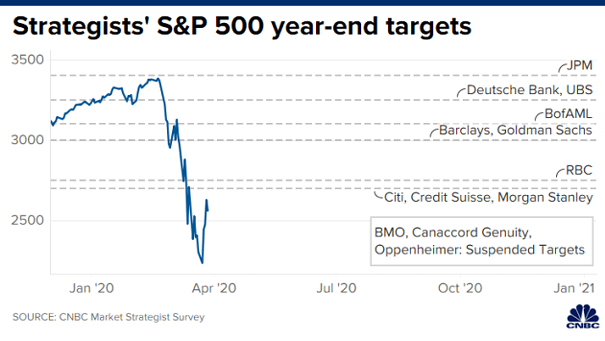
Strategists’ S&P 500 Year-End Targets
Strategists’ S&P 500 Year-End Targets Despite the extreme volatility, the consensus year-end target for the S&P 500 is now 3,038. Image: CNBC
Strategists’ S&P 500 Year-End Targets Despite the extreme volatility, the consensus year-end target for the S&P 500 is now 3,038. Image: CNBC
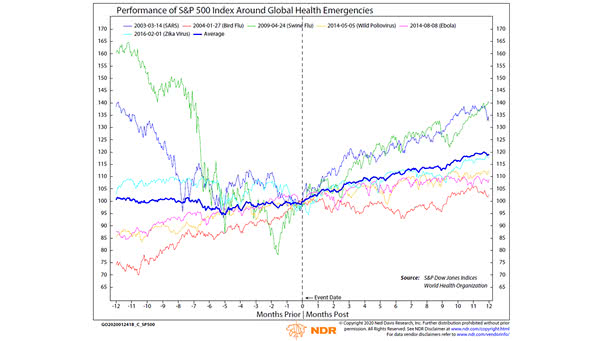
Performance of S&P 500 Index Around Global Health Emergencies Historically, market reactions to previous major health scares have shown short-term volatility, but no disruptions over an extended period of time. Image: Ned Davis Research
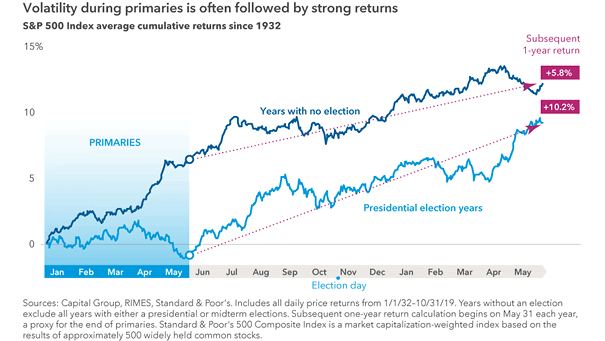
Presidential Election Years and S&P 500 Index Average Cumulative Returns This chart suggests that since 1932, volatility during primaries can produce strong returns. Image: Capital Group
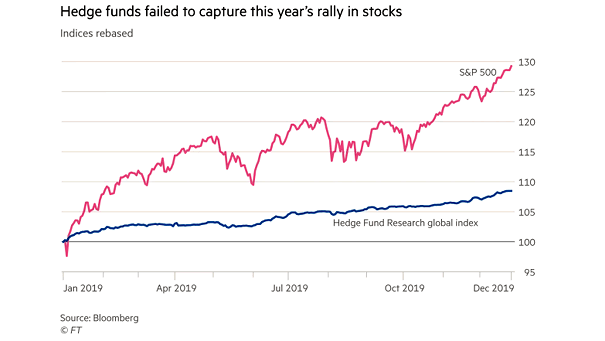
S&P 500 vs. Hedge Fund Research Global Index Hedge funds have underperformed the S&P 500 this year, but volatility has been lower. Image: Financial Times
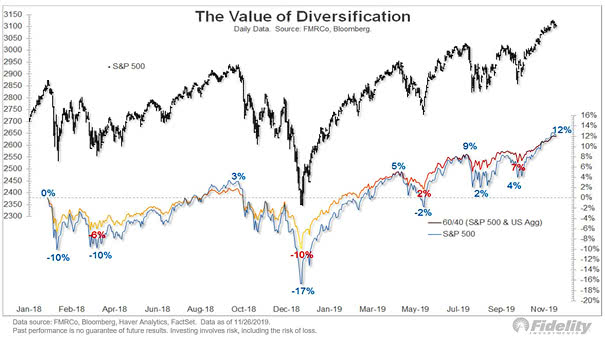
The Value of Diversification – 60/40 Portfolio vs. S&P 500 This chart shows the return and volatility of a 60/40 portfolio vs. S&P 500. Image: Fidelity Investments
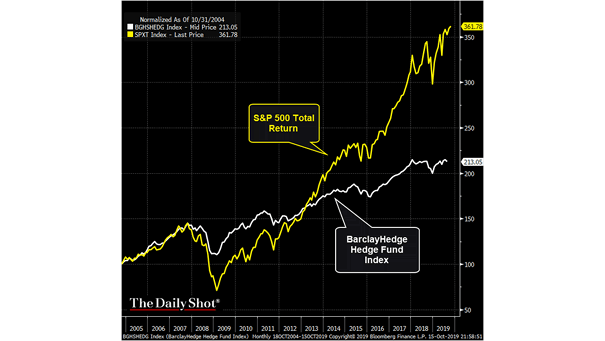
S&P 500 Total Return vs. BarclayHedge Hedge Fund Index Hedge funds have underperformed the S&P 500 over the past decade, but volatility has been lower. Image: The Daily Shot, Bloomberg
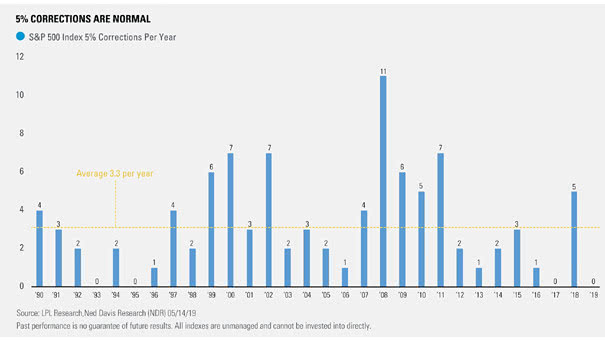
S&P 500 Index – Number of 5% Corrections Per Year Since 1990, there has been an average of 3.3 separate 5% declines for the S&P 500 per year. In a late business cycle, volatility increases. This is why, in 2019, we could see several drops of 5%. Image: LPL Research