Fed Assets as a Percentage of GDP

Fed Assets as a Percentage of GDP Will the Fed balance sheet decline to 20% of GDP by the end of 2025? Image: Deutsche Bank

Major Central Bank Assets vs. S&P 500 Index

Major Central Bank Assets vs. S&P 500 Index The expansion of central bank balance sheets tends to push the S&P 500 Index higher. Is the sky the limit? Image: Lohman Econometrics

Reserve Bank Credit, Treasury Securities and MBS

Reserve Bank Credit, Treasury Securities and MBS This chart shows how Reserve Bank credit has increased, as the Fed has continued to add treasury securities to its balance sheet. Image: Wells Fargo Investment Institute

Repo Market (Outstanding Repos) and Reserve Demand Curve

Repo Market (Outstanding Repos) and Reserve Demand Curve The Fed will expand its balance sheet again, by purchasing Treasury bills at least until mid-2020, which should rebuild the level of reserves in the system to $1.7 trillion. Image: BofA Merrill Lynch

QE to Infinity and Beyond?

QE to Infinity and Beyond? Analysts say the Fed will resume and buy “just” U.S. Treasuries next year. The Fed’s balance sheet should rise past its historic peak. Image: Bloomberg – Cartoon: Hedgeye Risk Management LLC

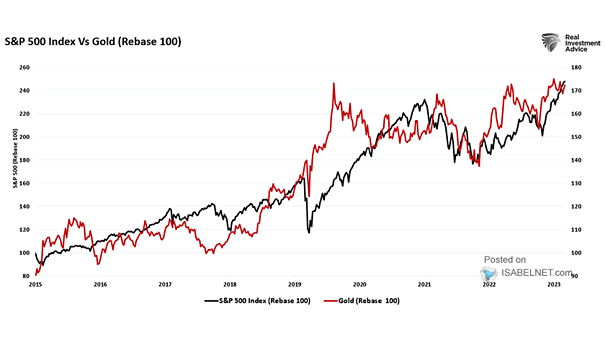
25-Year Cumulative Return of S&P 500 over Gold

25-Year Cumulative Return of S&P 500 over Gold Warren Buffett has a skeptical view of gold as an investment, but apparently, gold didn’t get the memo and has been outperforming the S&P 500 over the past 25 years! Image: Deutsche Bank

Treasury QT

Treasury QT The current context suggests that QT can continue even as the Fed begins to cut interest rates, provided that these cuts do not push the policy rate below what is considered neutral. Image: Deutsche Bank