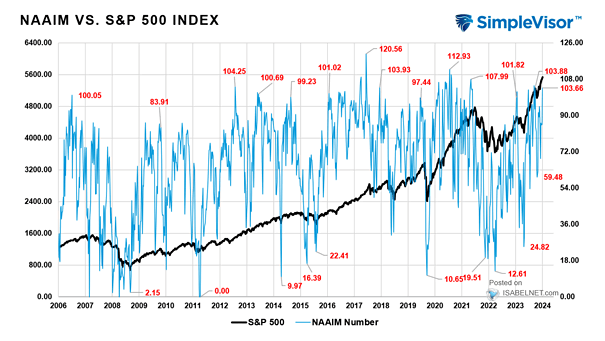
NAAIM vs. S&P 500 Index
NAAIM vs. S&P 500 Index Active investment managers frequently face criticism for their consistent pattern of selling equities at market bottoms and buying them at market tops. Image: Real Investment Advice
NAAIM vs. S&P 500 Index Active investment managers frequently face criticism for their consistent pattern of selling equities at market bottoms and buying them at market tops. Image: Real Investment Advice
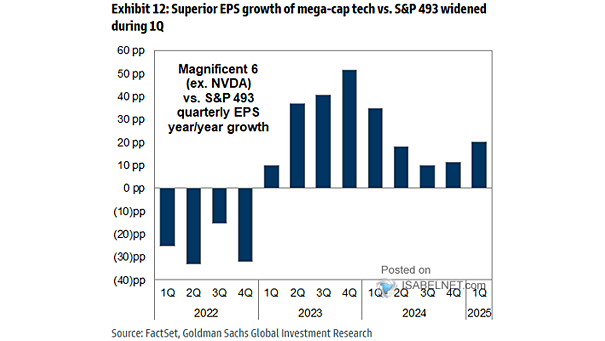
America’s Magnificent Seven Stocks The Magnificent Seven remain relatively expensive compared to the rest of the S&P 500 index, but their consistent performance and potential for growth continue to attract investors seeking long-term value. Image:…

Short Interest as % of Market Capitalization S&P 500 Median With a median short interest level of 1.8%, which remains relatively low, market participants are positive or cautiously optimistic about the future performance of the…
Bitcoin vs. Gold Bitcoin’s current price shares similarities with the price of gold in the 1970s. Image: Alpine Macro
U.S. Headline Inflation and U.S. Core PCE inflation Goldman Sachs expects U.S. PCE inflation to converge to 2% in late 2025, which could lead to a more predictable and stable economic landscape for U.S. consumers.…
CEO Confidence The recent improvement in CEO confidence in the U.S. indicates a renewed sense of optimism among business leaders. This is a significant development that can have far-reaching effects on the U.S. economy and…
Ranked Cross Asset Returns by Year Will gold retain its position as the top performer in 2024? Only time will tell, but given its enduring reputation as a safe haven investment and inflation hedge, gold…
Fed Rate Cuts Just 8% of FMS investors forecast no Fed cuts at all in 2024. Image: BofA Global Fund Manager Survey
Atlanta Fed GDPNow U.S. Real GDP Estimate The GDPNow model estimate for U.S. real GDP growth is 2.7% for 2024:Q1, highlighting the continued strength and resilience of the U.S. economy. Image: Federal Reserve Bank of…
Gold Price Gold prices tend to rise as U.S. public debt increases, suggesting a clear correlation between the two. Image: BofA Global Investment Strategy