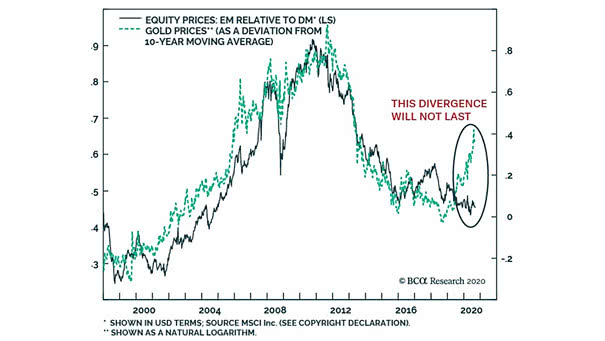
Equity Prices – EM Relative to DM vs. Gold Prices
Equity Prices – EM Relative to DM vs. Gold Prices Is the relative performance of emerging market equities vs. developed market equities at a major market turning point? Image: BCA Research
Equity Prices – EM Relative to DM vs. Gold Prices Is the relative performance of emerging market equities vs. developed market equities at a major market turning point? Image: BCA Research
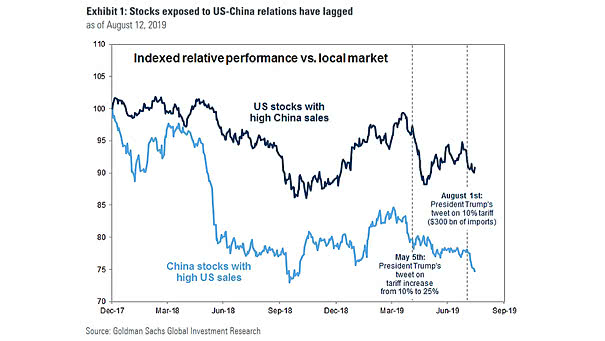
U.S. Stocks with High China Sales and China Stocks with High U.S. Sales US-China trade war affects the relative performance of U.S. and China stocks vs. local market. Image: Goldman Sachs Global Investment Research
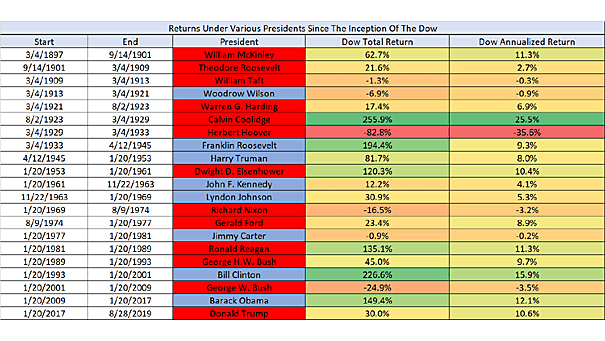
Returns Under Various Presidents since the Inception of the Dow Jones For President Trump, the stock market is a scorecard. This spreadsheet shows the Dow Jones performance across different presidencies since 1896. Image: Ryan Detrick, LPL Financial LLC
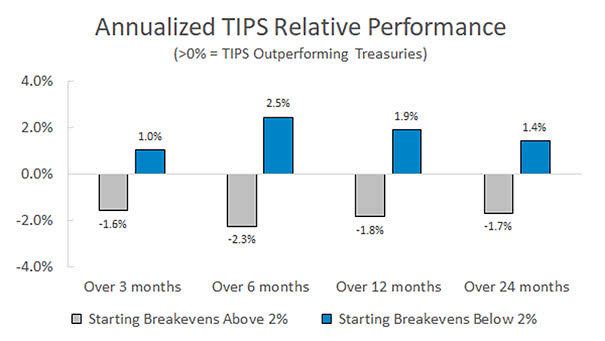
When Treasury Inflation-Protected Securities (TIPS) Outperform? The chart shows that Treasury Inflation-Protected Securities (TIPS) usually outperform regular Treasuries when the 10-year breakeven inflation rate is below 2%. The 10-year breakeven inflation rate is a market-based measure of expected inflation over the next 10 years. Image: Movement Capital LLC
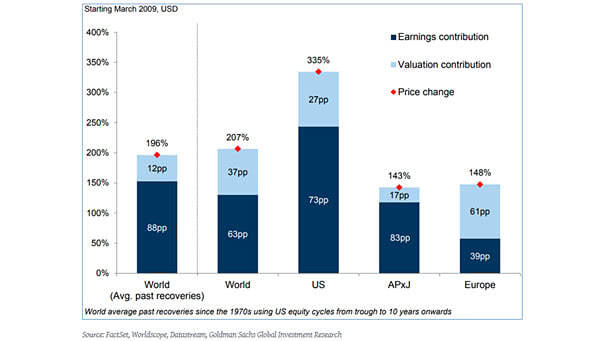
U.S. Equities and The World: Earnings Growth vs. Multiple Expansion Since the 2009 low, the strong performance of the U.S. markets comes from earnings growth (73%) and multiple expansion (27%). You may also like “S&P 500 Return: Earnings Growth vs. Multiple Expansion.” Image: Goldman Sachs Global Investment Research