
U.S. Federal Reserve – Assets and Fed Funds
U.S. Federal Reserve – Assets and Fed Funds Could the Federal Reserve raise interest rates later than expected? Image: BCA Research
U.S. Federal Reserve – Assets and Fed Funds Could the Federal Reserve raise interest rates later than expected? Image: BCA Research
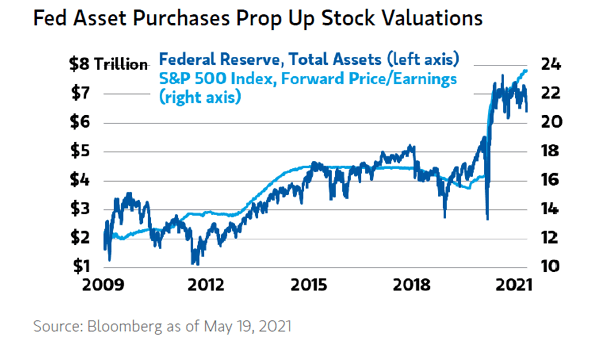
Valuation – Federal Reserve Total Assets and S&P 500 Index Forward Price/Earnings Will Fed asset purchases continue to push valuations higher indefinitely? Image: Morgan Stanley Wealth Management
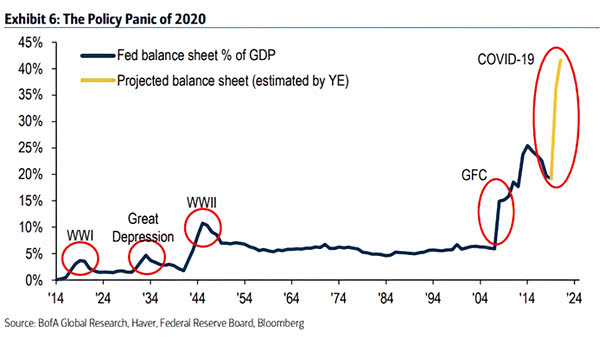
Federal Reserve Balance Sheet as % of GDP The Federal balance sheet is expected to expand by more than 40% of GDP. Image: BofA Global Research
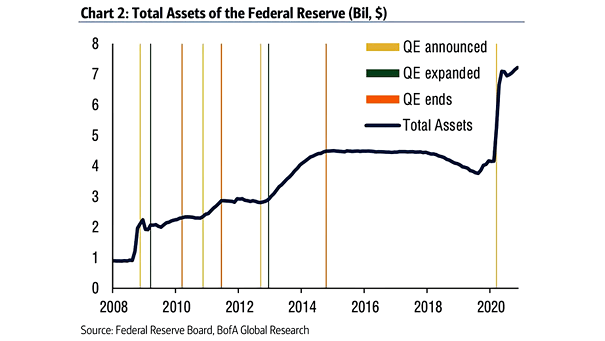
Quantitative Easing (QE) – Total Assets of the Federal Reserve Are investors facing a reality of QE to infinity and beyond? Image: BofA Global Research
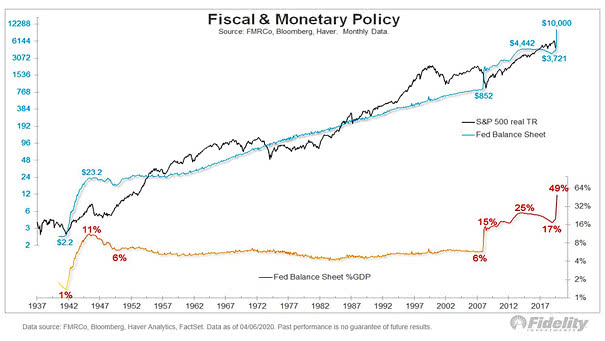
S&P 500 Real Total Return and Federal Reserve Balance Sheet As this chart illustrates, the Fed balance sheet could grow to $10 trillion, equivalent to 49% of U.S. GDP. Image: Fidelity Investments
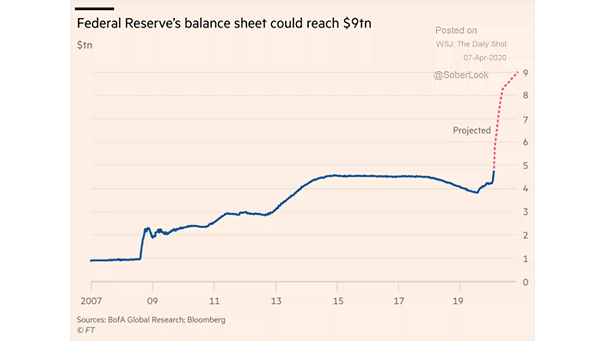
Federal Reserve’s Balance Sheet The Federal Reserve’s balance sheet could exceed US$ 9 trillion at the end of 2020, equivalent to more than 40% of US GDP. Image: Financial Times
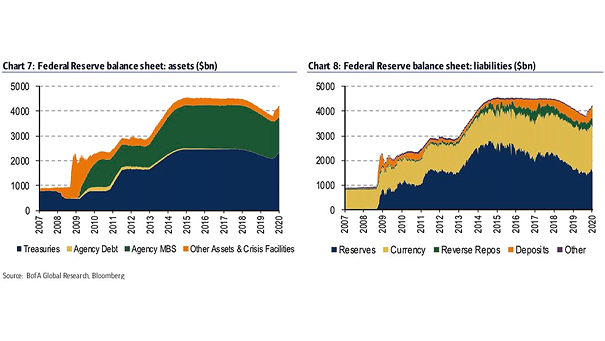
Federal Reserve Balance Sheet: Assets and Liabilities This chart shows the total assets and liabilities of the Federal Reserve. According to the NY Fed, the Fed’s balance sheet could be between $3.8 trillion and $4.7 trillion by 2025. Image: BofA Global Research
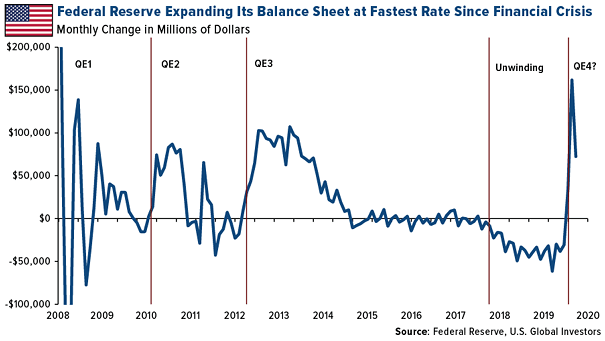
Federal Reserve’s Balance Sheet and “Not QE” Welcome to “Not-QE”. The Fed’s balance sheet is expanding at fastest rate since the Great Financial Crisis. Image: US Global Investors
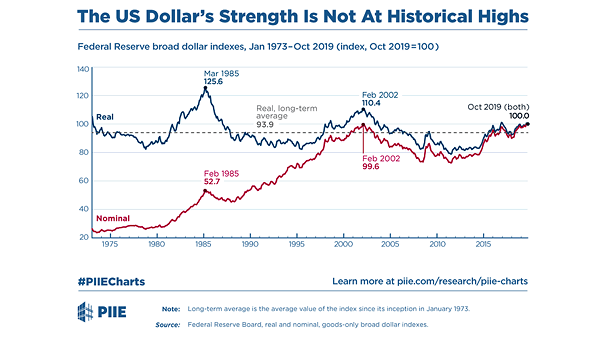
Federal Reserve Broad Dollar Indexes The dollar’s current level in real terms is elevated, but lower than previous peaks. Image: Peterson Institute for International Economics
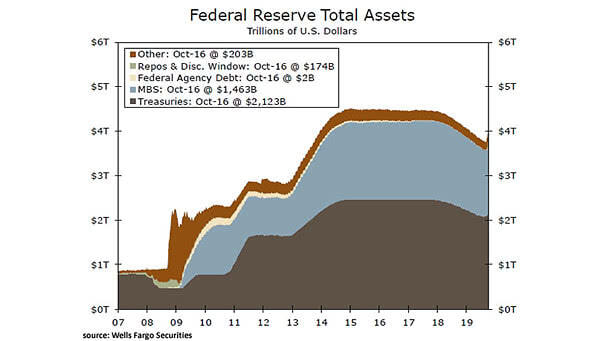
Federal Reserve’s Balance Sheet This chart shows the Federal Reserve total assets. According to the NY Fed, the Fed’s balance sheet could be between $3.8 trillion and $4.7 trillion by 2025. Image: Wells Fargo Securities, LLC
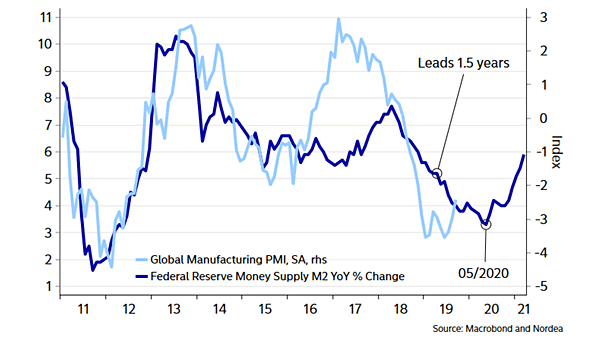
Federal Reserve Money Supply M2 Leads Global Manufacturing PMI Chart suggesting that the Federal Reserve money supply M2 leads global manufacturing PMI by 18 months. Image: Nordea and Macrobond