Gold Drawdown from Its Trailing Previous Peak

Gold Drawdown from Its Trailing Previous Peak Gold has just suffered one of its steepest pullbacks in more than a decade. The drop looks less like the start of a lasting reversal and more like a classic flush after a prolonged rally. Image: Goldman Sachs Global Investment Research
Gold Model

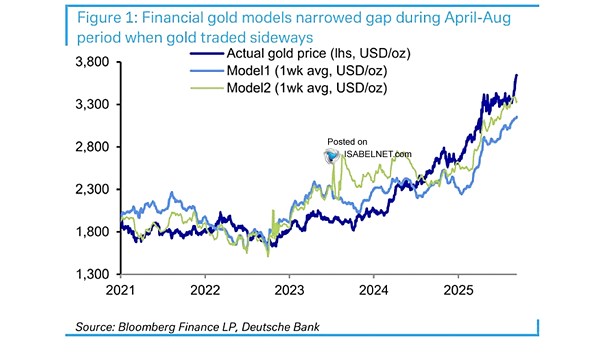
Gold Model Using a model that incorporates real yields, the dollar, the S&P 500, and copper, gold now appears to be trading near fair value again. That leaves investors with a neutral signal. Image: Bloomberg

S&P 500 in Gold Terms

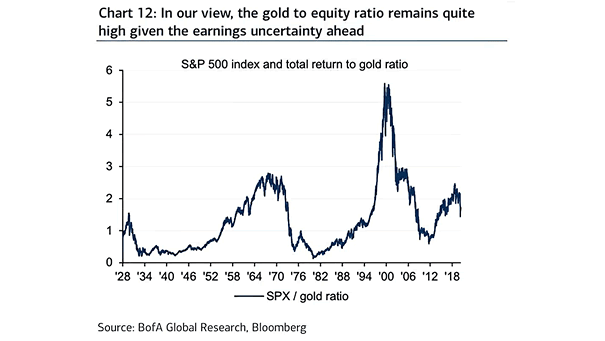
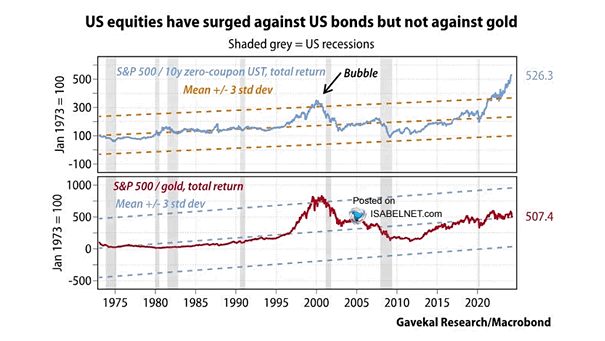
S&P 500 in Gold Terms The S&P 500 priced in gold, often used to track real strength versus currency debasement, broke sharply higher three months ago, pointing to a shift toward stronger risk appetite. Image: Bloomberg

Gold Futures

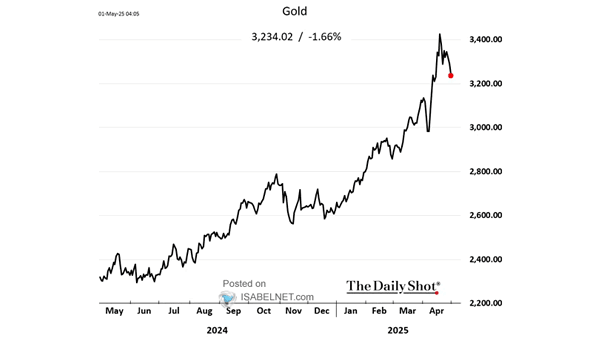
Gold Futures Gold’s 2026 gains have evaporated as sentiment flipped from rate cuts to higher-for-longer expectations. A stronger U.S. dollar is adding pressure, while forced selling to cover losses elsewhere is accelerating the selloff. Image: The Daily Shot

Gold vs. Oil vs. Fed Pricing

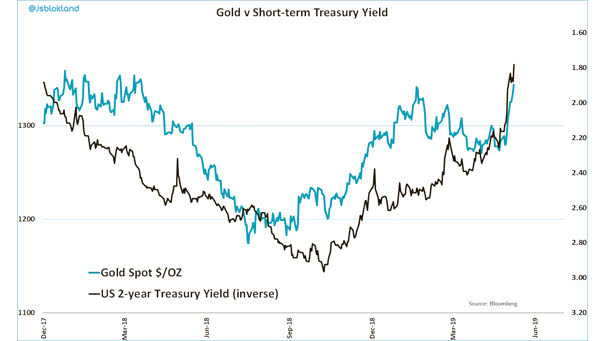
Gold vs. Oil vs. Fed Pricing After moving opposite to oil in March and April, gold diverged in May and is now trading more in line with Fed rate expectations. Image: Deutsche Bank Research

Central Bank Gold Purchases

Central Bank Gold Purchases Central bank gold buying eased to 863 tonnes in 2025 from 1,092 tonnes in 2024. Buying has cooled, but official-sector demand remains well above historical standards and continues to play a strategic role in reserve diversification. Image: Real Investment Advice

Gold as a Share of Total Central Bank FX Reserves

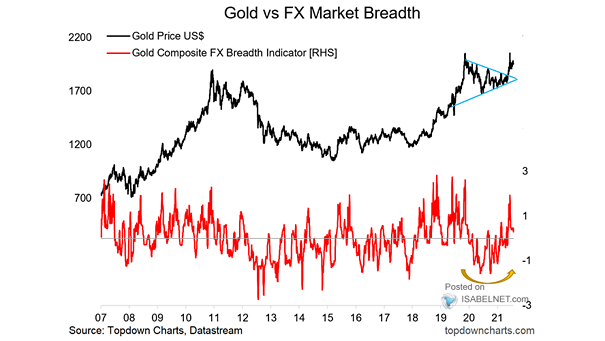
Gold Price vs. Gold Composite FX Breadth Indicator Gold’s role is shifting: it’s no longer just a safe haven but a cornerstone of monetary stability as central banks keep adding to their reserves in an increasingly fragile global system. Image: J.P. Morgan Flows and Liquidity

Bitcoin, Gold and S&P 500’s Performance

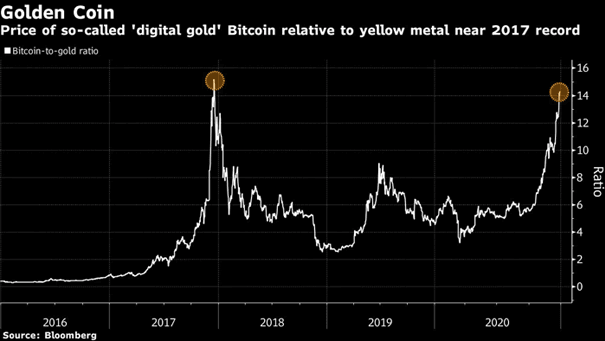
Bitcoin, Gold and S&P 500’s Performance Bitcoin has lost some ground lately, but at about 370% above its early‑2023 lows, it looks less like a speculative bet and more like a market finding its footing. Image: Deutsche Bank Research

Gold to S&P 500 Ratio

Gold to S&P 500 Ratio Gold’s outperformance has pushed the Gold-to-S&P 500 ratio to its highest since 2013, signaling a defensive shift but not yet the kind of rush to safety seen during crisis years. Image: Goldman Sachs Global Investment Research

Gold vs. 50/50 S&P 500 and U.S. Treasuries

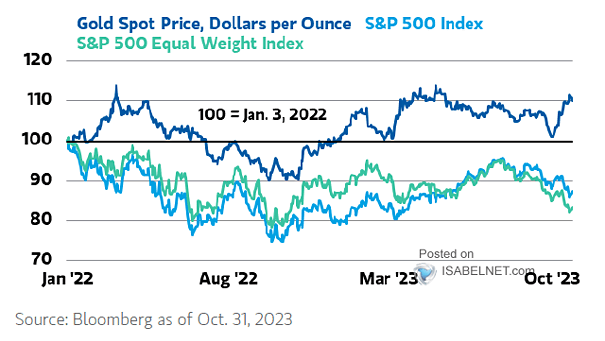
Gold Price vs. S&P 500 Gold has recently surpassed $5,000 per ounce, but it still looks cheap next to a balanced 50/50 portfolio of U.S. stocks and Treasuries. Image: Bloomberg