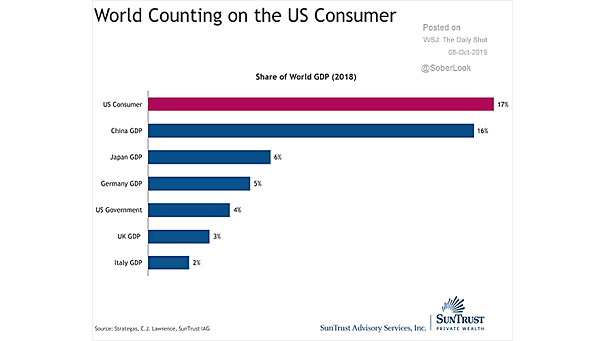
World Counting on the U.S. Consumer
World Counting on the U.S. Consumer The U.S. consumer accounts for 17% of world GDP. That’s more than China’s GDP. Image: Truist
World Counting on the U.S. Consumer The U.S. consumer accounts for 17% of world GDP. That’s more than China’s GDP. Image: Truist
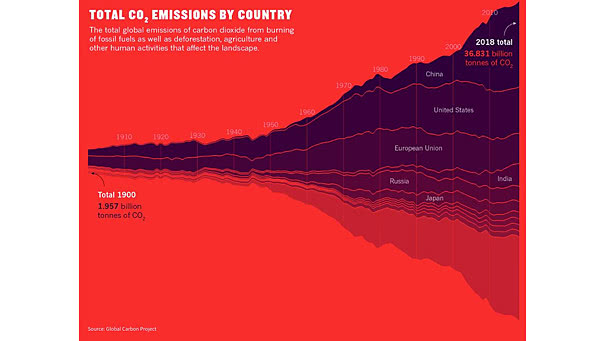
Total Carbon Emissions by Country (CO2) China, the United States, and India account for almost half of the total global carbon emissions. Image: Global Carbon Project
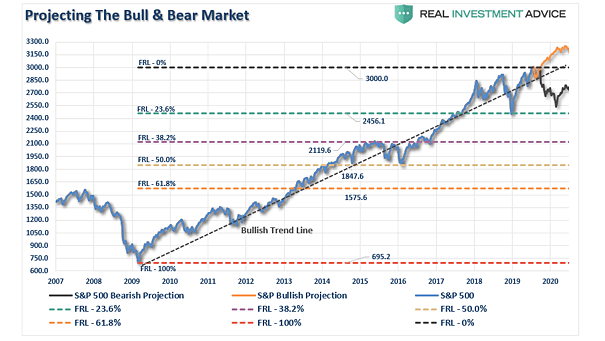
Projecting the Bull and Bear Market If a US-China trade deal is reached, this chart suggests a rally to the long-term bullish trend line at 3300. Image: Real Investment Advice
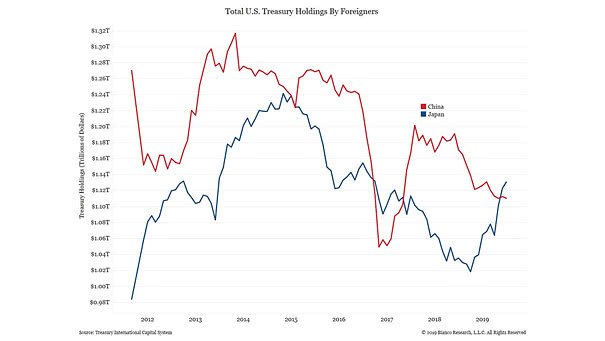
Total U.S. Treasury Holdings by Foreigners Japan and China are the two major foreign holders of U.S. Treasury securities. And currently, Japan surpasses China. Image: Bianco Research
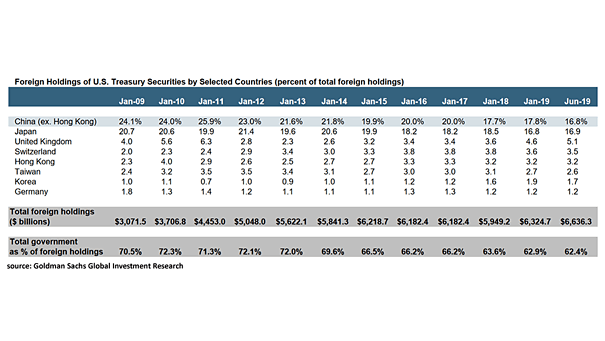
Foreign Holdings of U.S. Treasury Securities by Selected Countries Japan and China are the two major foreign holders of U.S. Treasury securities. Currently, Japan surpasses China as largest foreign holder of U.S. Treasuries. Image: Goldman Sachs Global Investment Research
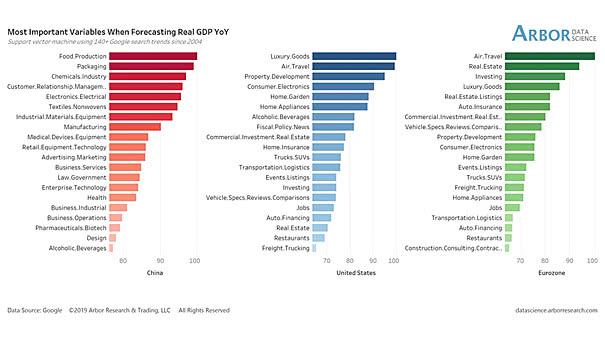
Most Important Variables When Forecasting Real GDP Search trends are very different between China (manufacturing industry) and the USA/Eurozone (consumer), when forecasting real GDP. Image: Arbor Research & Trading LLC
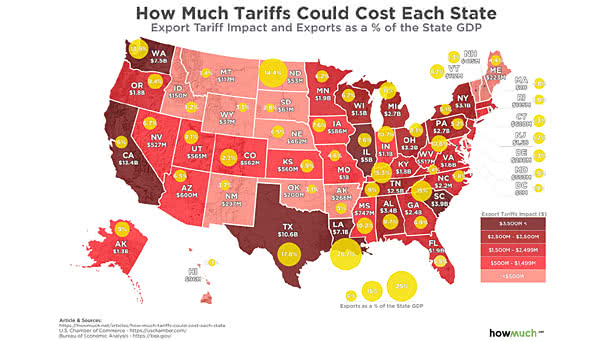
How Much Tariffs Could Cost Each State? This chart shows how much each state would be affected by China’s export tariffs. Image: howmuch.net
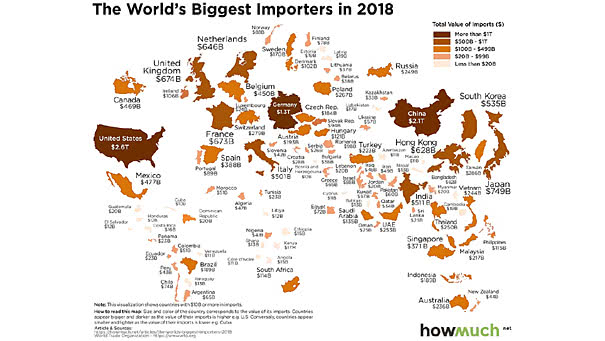
The World’s Biggest Importers The U.S. is the largest importer in the world, followed by China and Germany. You may also like “The World’s Biggest Exporters.” Image: howmuch.net
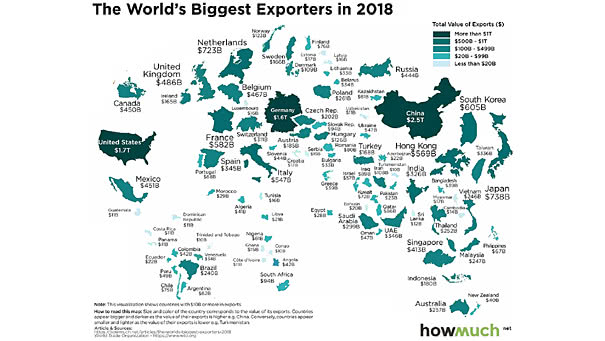
The World’s Biggest Exporters China is the largest exporter in the world, followed by the U.S. and Germany. You may also like “The World’s Biggest Importers.” Image: howmuch.net
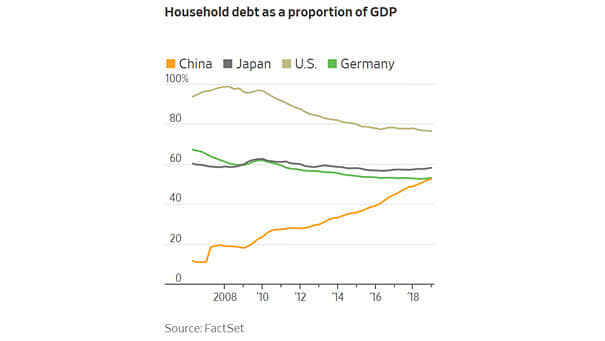
Household Debt as a Proportion of GDP Household debt levels in China are equivalent to those in advanced economies. Image: The Wall Street Journal
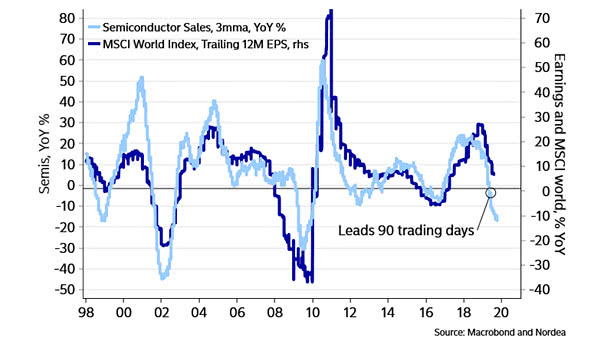
World Semiconductor Sales Lead Emerging Markets This chart suggests that world semiconductor sales lead the MSCI emerging markets index by 3 months. This is very interesting before investing in emerging market equities. Country weights of the MSCI Emerging Markets Index: 33% China, 13.02% Korea, 11.35% Taiwan. Image: Nordea and Macrobond