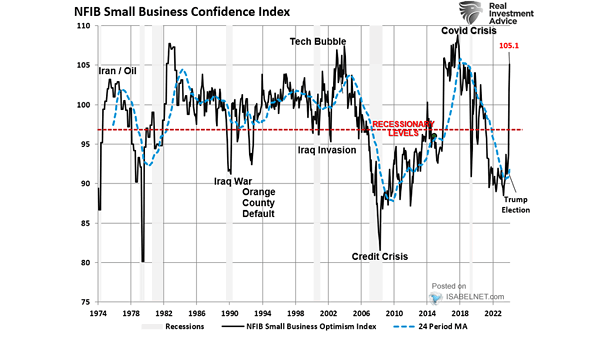
U.S. Election and Equities
U.S. Election and Equities Among advisors, the survey shows that the U.S. election is the biggest risk to equities. BofA US Equity & US Quant Strategy
S&P 500 Price Returns Relative to Onset of Next U.S. Recession The performance of the S&P 500 has generally been positive until six months prior to a recession. Image: Investment Strategy Group, Bloomberg
Bond Fund Flows Bond funds hit inflow record, reflecting investor fears about the coronavirus’s spread. Image: BofA Global Investment Strategy
Odds of Various S&P 500 One-Year Total Returns During U.S. Economic Expansions This chart suggests the probability of positive one-year market returns when the U.S. economy is expanding. Image: Investment Strategy Group, Bloomberg
Odds of Winning U.S. Presidential Election Here’s a look at the current betting odds for Donald Trump, Michael Bloomberg and Bernie Sanders. Image: BofA Global Investment Strategy
Relative P/E of Value Stocks vs. S&P 500 vs. U.S. Manufacturing PMI Index BofA remains bullish on value stocks in the coming months, due to improving macro conditions. Image: BofA U.S. Equity and Quant Strategy
Global Central Bank Balance Sheet Growth and Quantitative Easing BofA suggests that global central bank balance sheets will peak at $879bn in September 2020. Image: BofA Global Investment Strategy
History of Asset Bubbles Past 40-Years This chart puts into perspective the history of asset bubbles over the past 40 years. Image: BofA Global Investment Strategy
S&P 500 vs. Global Wealth and Investment Management Equity as % AUM Global Wealth and Investment Management (GWIM) equity allocation is flat, while the S&P 500 is at all-time high. Image: BofA Global Investment Strategy
Inflows into Tech Funds This chart puts into perspective the annualized inflows into Tech funds. Image: BofA Global Investment Strategy