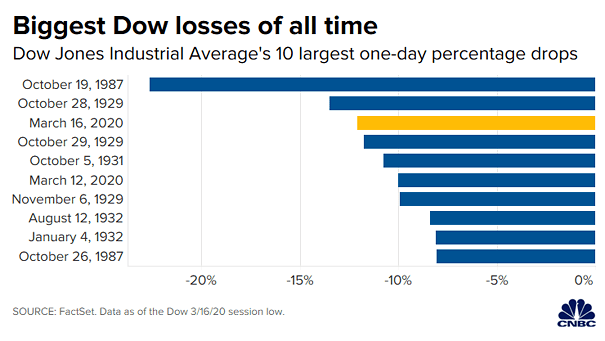
Dow Jones Industrial Average’s 10 Largest One-Day Percentage Drops
Dow Jones Industrial Average’s 10 Largest One-Day Percentage Drops Yesterday was one the biggest Dow Jones losses of all time. Image: CNBC
Dow Jones Industrial Average’s 10 Largest One-Day Percentage Drops Yesterday was one the biggest Dow Jones losses of all time. Image: CNBC
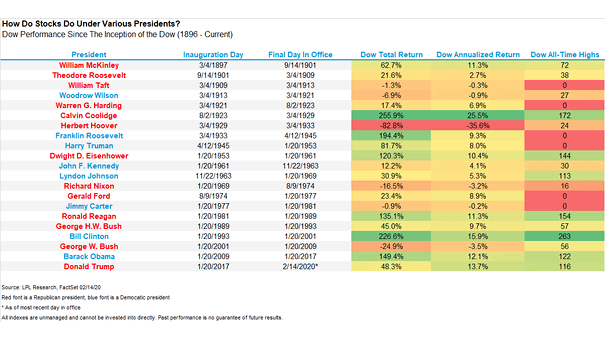
Dow Jones Performance Under Various U.S. Presidents This chart puts into perspective the Dow Jones performance under various U.S. presidents. The annualized return under President Trump is high, given tightening monetary policy. Image: Ryan Detrick, LPL Financial LLC
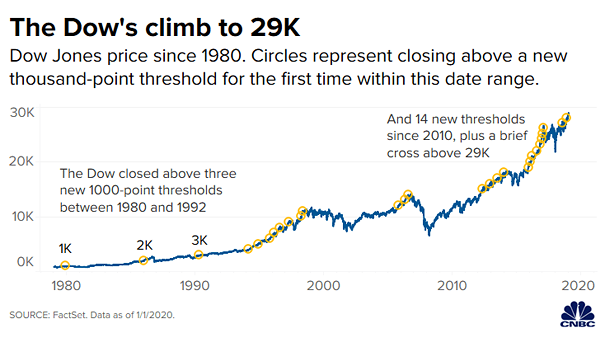
Dow Jones Price Since 1980 Historical chart of the Dow Jones from 1K to 29K. Image: CNBC
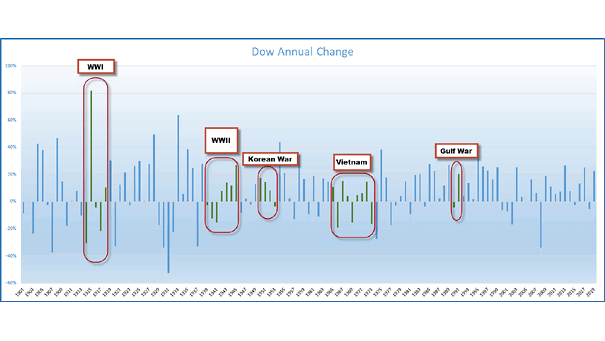
Dow Jones Annual Change with All Major Conflicts since WWI Chart showing how the Dow Jones has behaved in times of conflict. The best annual return took place during WWI. Image: Ryan Detrick, LPL Financial LLC
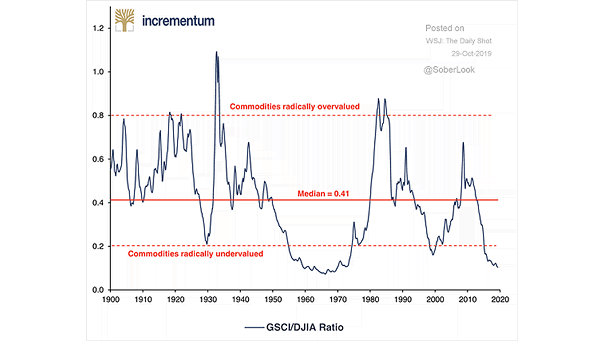
Commodities vs. Dow Jones Industrial Average Chart suggesting that commodities are very undervalued relative to the U.S. stock market. Image: Incrementum
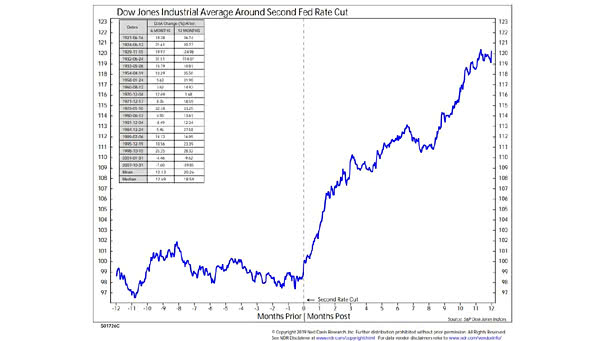
Dow Jones Industrial Average Around Second Fed Rate Cut This chart shows that a second rate cut has been bullish. On average, the Dow Jones Industrial Average has gained 19% over the next 12 months. Image: Ned Davis Research
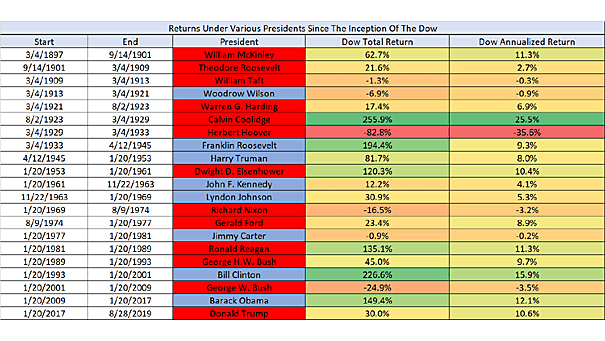
Returns Under Various Presidents since the Inception of the Dow Jones For President Trump, the stock market is a scorecard. This spreadsheet shows the Dow Jones performance across different presidencies since 1896. Image: Ryan Detrick, LPL Financial LLC
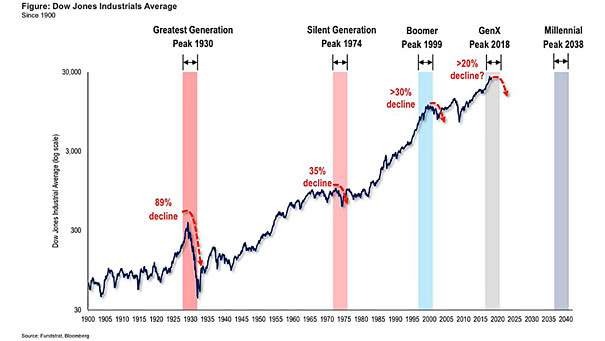
Demographics – Dow Jones and Generational Peaks This chart shows that generational peaks are associated with major market tops. GenX peaked in 2018 and Millennials don’t peak until 2038. Image: Fundstrat Global Advisors, LLC
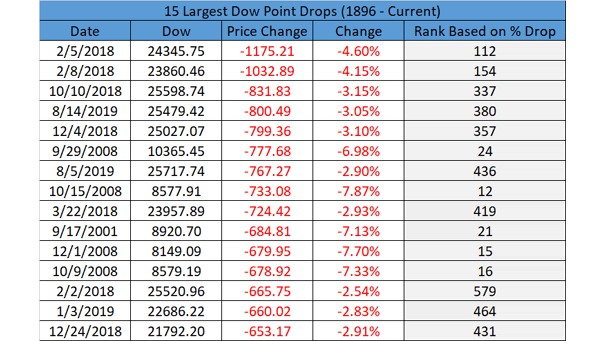
15 Largest Dow Jones Point Drops Going back to 1896, yesterday was the 380th largest percentage drop ever for the Dow Jones. Image: LPL Research
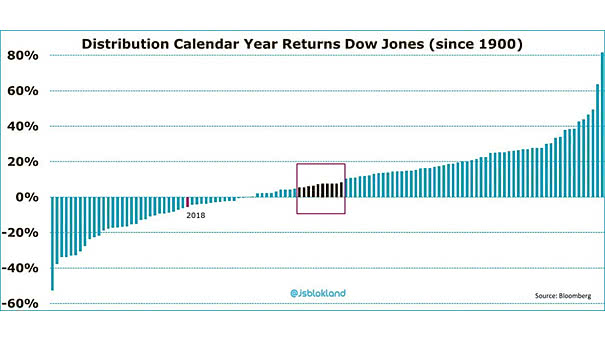
Distribution of Calendar Year Returns: Dow Jones since 1900 The chart shows the calendar year returns on the Dow Jones since 1900, from lowest to highest. It also show that an average return (black bars) does not really exist if we take into account the distribution of calendar year returns since 118 years. Image: Jeroen Blokland
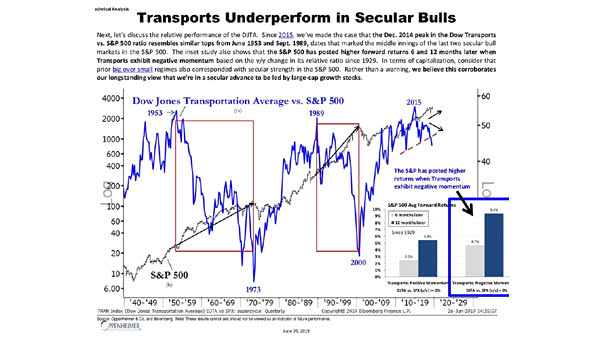
Dow Jones Transportation Average vs. S&P 500 This interesting chart suggests that the Dow Jones Transportation Average underperforms in secular bull markets. Actually, the S&P 500 had higher returns when the Dow Jones Transportation Average experienced negative momentum. Image: Oppenheimer & Co.