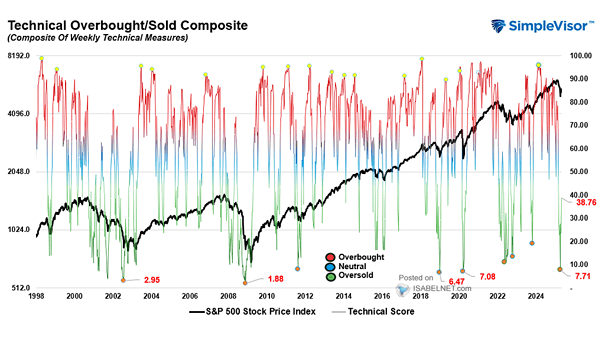
VIX and MOVE Rolling Correlation

VIX and MOVE Rolling Correlation Periods of high correlation between safe and risk assets are generally not good for balanced portfolios, because diversification is hard to find. Image: Arbor Research & Trading LLC

Money Market Fund Flows and Probability of Recession

Money Market Fund Flows and Probability of Recession Investors move to safe assets by raising their cash holdings, like 2007/2008. This chart suggests that the probability of a recession in the next 12 months is high. Image: Goldman Sachs Global Investment Research

Correlation Matrix

Correlation Matrix This grid shows the correlation between different asset classes. It is very useful for asset allocation. Image: Fidelity Investments

S&P 500 Performance Leading to U.S. Election Date

S&P 500 Performance Leading to U.S. Election Date This table shows that over the last 20 election cycles in the U.S., there have been only two instances of market declines in the 12 months leading to the election results. Image: J.P. Morgan Asset Management

S&P 500 Tax Adjusted EPS vs. Trend

S&P 500 Tax Adjusted EPS vs. Trend Interesting chart showing that S&P 500 tax adjusted earnings are well above the trend in the United States, and have historically preceded earning plunges. Image: J.P. Morgan Asset Management

NFIB Survey Leads U.S. Employment

NFIB Survey Leads U.S. Employment The U.S. economy is not unaffected by the trade war and global slowdown. This chart suggests that U.S. employment is slowing down. The chart also suggests that the NFIB survey leads U.S. employment by 6 months. Image: Rothschild & Co Asset Management Europe