S&P 500 and Liquidity
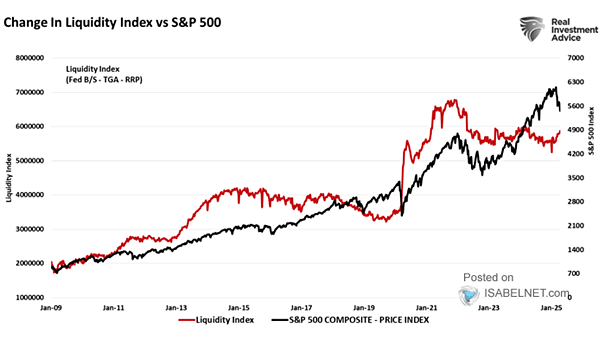
S&P 500 and Liquidity The increase in aggregate U.S. liquidity since the lows of October 2022 has played a significant role in the upward trend of U.S. stocks, sparking a sense of optimism among market…
S&P 500 and Liquidity The increase in aggregate U.S. liquidity since the lows of October 2022 has played a significant role in the upward trend of U.S. stocks, sparking a sense of optimism among market…
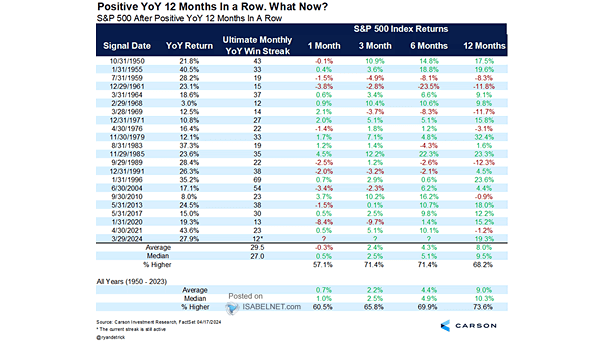
S&P 500 After Positive YoY 12 Months in a Row When the S&P 500 is positive YoY 12 months in a row, the next 12 months tend to be bullish, with a median return of…

Corporate Clients – Buybacks (4-Week Average) The robust stock buyback activity of BofA’s corporate clients is likely to be perceived as highly favorable by investors. Image: BofA Securities
U.S. 10-Year Treasury Yield – Daily Chart With inflationary pressures persisting and the economy showing signs of robust expansion, the U.S. 10-year Treasury yield has the potential to go higher. Image: BofA Global Research
Probability of U.S. Recession In the Next 1 Year Goldman Sachs’ outlook suggests a positive sentiment regarding the U.S. economy’s ability to avoid recession in the near future, with only a 15% chance of recession…
FMS Average Cash Balance The FMS cash level has fallen to 4.2% from 4.4%, but it is not currently considered a contrarian sell signal for stocks. Image: BofA Global Fund Manager Survey
What Do You Think Is Currently the Most Crowded Trade? Among FMS investors, the “Long Magnificent Seven” trade continues to be seen as the most crowded trade, with the popularity of these stocks being attributed…
Commodities – FMS Global Commodity FMS investors have become more optimistic on commodities in April, contributing to a record monthly increase in commodities allocation. Image: BofA Global Fund Manager Survey
FMS Net % Expecting Stronger Economy vs. S&P 500 FMS investors are more optimistic and expect a stronger global economy over the next 12 months. The disconnect between the macroeconomic perspective of FMS investors and…
FMS Investor Positioning In April, FMS investors overweighted their exposure to stocks, healthcare, and Eurozone, while reducing their exposure to utilities, UK, REITS, and bonds. Image: BofA Global Fund Manager Survey