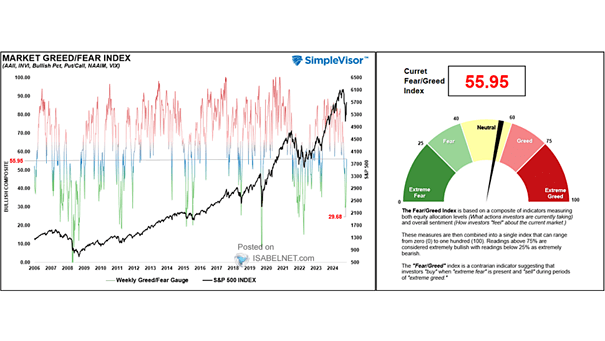
Top 5 vs. S&P 500 ex-Top 5 – YoY Contribution of EPS and P/E to Returns

Top 5 vs. S&P 500 ex-Top 5 – YoY Contribution of EPS and P/E to Returns The performance gap could widen further, as the top 5 largest stocks in the S&P 500 are superior on almost every financial metric (revenue, profit growth, margin structure, volatility and corporate leverage). Image: Credit Suisse Research

Interaction of S&P 500 and VIX

Interaction of S&P 500 and VIX In contrast to 2008, the current VIX and its lack of decline in recoveries suggest volatility in equities could persist. Image: Deutsche Bank

S&P 500 Average Daily Percentage Move: 1928-2020

S&P 500 Average Daily Percentage Move: 1928-2020 The volatility has been unusual over the last five weeks, as the S&P 500’s average absolute daily percentage change has been +/-4.8%. Image: Bespoke Investment Group

Performance of S&P 500 Index Around Global Health Emergencies

Performance of S&P 500 Index Around Global Health Emergencies Historically, market reactions to previous major health scares have shown short-term volatility, but no disruptions over an extended period of time. Image: Ned Davis Research

Performance of Hedge Fund Index vs. S&P 500

Performance of Hedge Fund Index vs. S&P 500 Hedge fund returns have not been as good as those of the S&P 500, but volatility has been lower. Image: Richardson Wealth