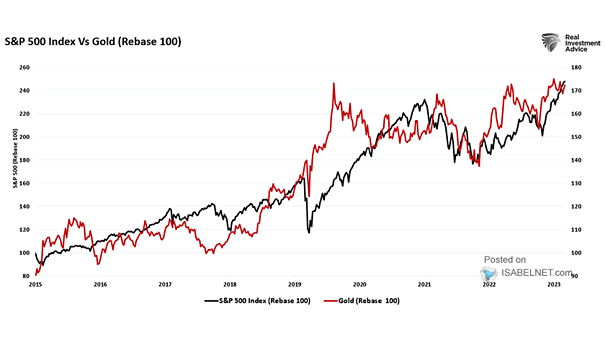
Global Manufacturing PMI Leads Earnings
Global Manufacturing PMI Leads Earnings The chart suggests that Global Manufacturing PMI leads earnings by 9 months. Image: Charles Schwab
Philadelphia Semiconductor Index (SOX) Leads Global Manufacturing PMI by Three Months This chart suggests that the rally in semiconductor stocks may herald a global growth rebound. Image: Oxford Economics, Macrobond
Global Real M1 Growth Leads Global Manufacturing PMI by around 6 Months When global real M1 money supply growth is very low, it does not bode well for global economic activity. Image: The Wall Street Journal
Global Manufacturing PMIs – USA vs. Rest of the World Global ex-US manufacturing PMI is below 50 (contraction). We will see if the United States can go it alone in the coming months. You may also like “ISM Manufacturing Index vs. S&P 500 Index since 2011“ Image: Topdown Charts
Global Quarterly Tech Capex Growth Tech investment has surged in recent years, but the underlying rhythm hasn’t changed: global tech capex has grown 14.6% annually since 2013, right in line with its decade‑long trend. Image: Goldman Sachs Global Investment Research
Global Financial Conditions Index Global financial conditions have eased to a 12-month low, supported by expectations of monetary policy easing, improved investor sentiment, tightening credit spreads, and a more stable economic outlook. Image: Goldman Sachs Global Investment Research
U.S. Nonfarm Payrolls vs. U.S. ISM Manufacturing PMI The U.S. ISM manufacturing index reading below 50 signals a contraction in manufacturing activity, which may impact payroll numbers. However, the relationship between the index and actual payroll figures is not straightforward. Image: BofA Global Investment Strategy
ISM Manufacturing PMI and ISM New Orders – Inventories The spread between U.S. ISM New Orders and Inventories suggests a positive upward trend in the ISM manufacturing PMI, with new orders increasing at a more rapid pace than inventories. Image: BofA Global Investment Strategy
Percentage of Countries with Manufacturing PMI Above 50 While the global manufacturing sector faced headwinds in mid-2023, the latest data suggest a gradual recovery is underway, with the percentage of countries in expansion nearly doubling from September 2023 to the present. Image: BofA Predictive Analytics
ISM Manufacturing PMI and U.S. Recessions A drop in the U.S. ISM Manufacturing PMI below 45 signals significantly heightened recession risks, indicating a severe contraction in the manufacturing sector. Image: BofA Global Research
Big 4 Asia Imports vs. ISM Manufacturing PMI The weak demand in Asian markets is affecting various industries and economies worldwide. Image: BofA Global Investment Strategy