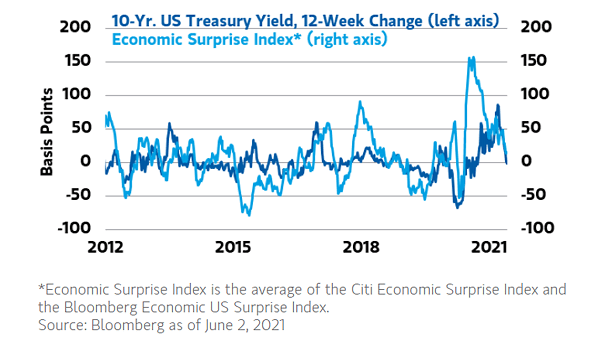
U.S. 10-Year Treasury Yield and Economic Surprise Index
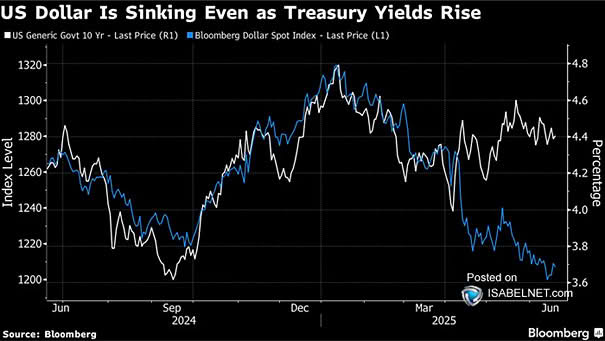
U.S. 10-Year Treasury Yield and Economic Surprise Index Weakening U.S. economic data and evolving fiscal conditions have led Goldman Sachs to revise down Treasury yield forecasts, anticipating a more accommodative monetary policy with earlier and multiple Fed rate cuts in 2025. Image: Bloomberg