S&P 500 Earnings Estimates Through 2022
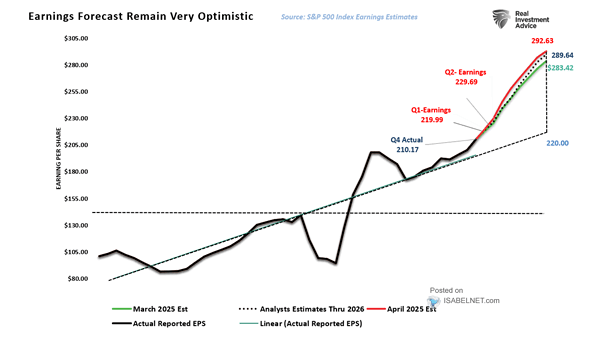
S&P 500 Earnings Estimates Through 2022 Morgan Stanley expects S&P 500 earnings to fall to $138 this year, before rebounding to $175 in 2021 and $193 in 2022. Image: Morgan Stanley Research
S&P 500 Earnings per Share vs. ISM Manufacturing New Orders The jump in new ISM manufacturing orders suggests a significant rebound in S&P 500 earnings growth. Image: Morgan Stanley Wealth Management
U.S. Producer Price Inflation and S&P 500 Earnings There is little doubt that the bottom in earnings is in for this cycle, as U.S. producer prices rose more than expected in September. Image: Jeroen Blokland
Estimated S&P 500 Earnings Impact of Biden Policies Chart suggesting that there are both upside and downside risks to future S&P 500 earnings. Image: Goldman Sachs Global Investment Research
Style Index Performance During Periods of Decelerating and Accelerating S&P 500 Earnings Growth – Russell 1000 Value vs. Growth Is it time for investors to favor value stocks, as Value tends to beat Growth when profits accelerate? Image: BofA US Equity & Quant Strategy
Estimated S&P 500 Earnings Impact Based on Biden’s Proposals Joe Biden’s tax proposal could significantly reduce S&P 500 earnings, if passed into law. Image: BofA US Equity & Quant Strategy
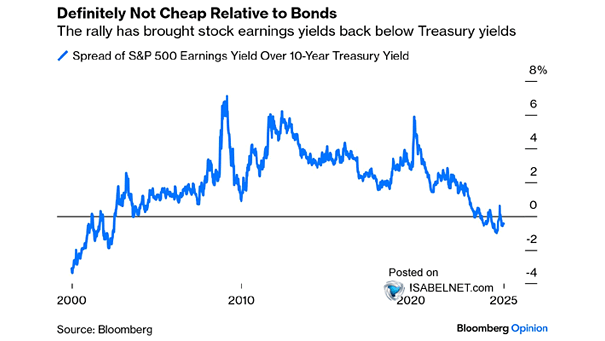
Gap Between S&P 500 Earnings Yield and U.S. Treasury Yield This chart suggests that the S&P 500 looks attractive relative to bonds, as the spread between the S&P 500 earnings yield and the U.S. 10-year Treasury yield is 368bps. Image: Goldman Sachs Global Investment Research
S&P 500 vs. ISM PMI and S&P 500 Earnings Revisions Breadth Chart suggesting that the S&P 500 is simply following the rebound in both PMIs and earnings revisions breadth. Image: Morgan Stanley Research
S&P 500 Earnings Revisions Breadth vs. Dollar Index (DXY) Chart suggesting the good correlation between S&P 500 earnings revisions and the U.S. dollar. Image: Morgan Stanley Research
Equity Risk Premium (ERP) – S&P 500 Earnings Yield Minus 10-Year Treasury Yield Chart suggesting that the S&P 500 looks attractive relative to bonds. Image: SunTrust Private Wealth Management