Europe – Equity Performance During Recent Conflicts
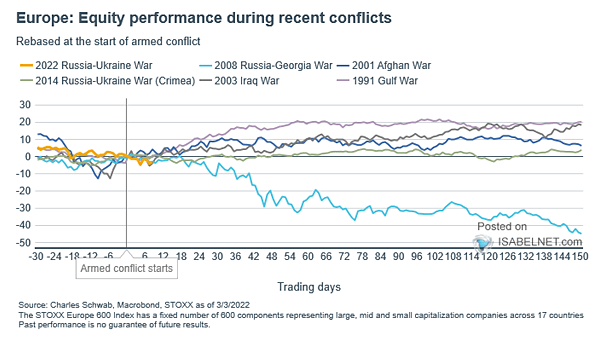
Europe – Equity Performance During Recent Conflicts If there is no recession, european stocks tend to do well after the start of armed conflicts. Image: Charles Schwab
Europe – Equity Performance During Recent Conflicts If there is no recession, european stocks tend to do well after the start of armed conflicts. Image: Charles Schwab
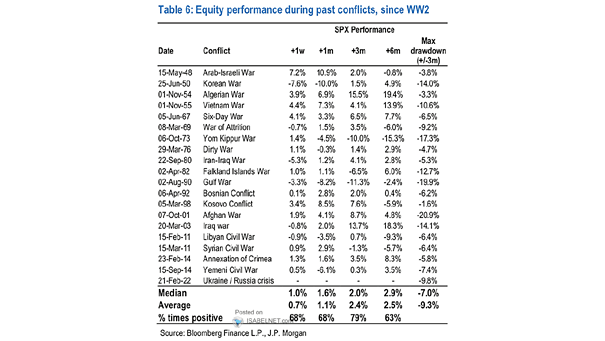
S&P 500 – Equity Performance During Past Conflicts, Since WWII Historically, the impact of past conflicts on U.S. stocks has tended to be short-lived since WWII. Image: J.P. Morgan

Average Price Performance of Gold, Oil and Base Metals during Four Military Conflicts This chart shows the average price performance of gold, oil and base metals during the following military conflicts: 1980 Iran-Iraq War, 1990 Gulf War, 2003 Iraq War, 2011 NATO-led military intervention in Libya. Image: J.P. Morgan Commodities Research
Dow Jones Annual Change with All Major Conflicts since WWI Chart showing how the Dow Jones has behaved in times of conflict. The best annual return took place during WWI. Image: Ryan Detrick, LPL Financial LLC
US-China Trade War and Past Major Trade Conflicts In the past, tariffs were in place for long periods of time. The US-China trade war is hitting global growth, by his importance, size and scope. Image: Goldman Sachs Global Investment Research
Brent Crude Oil Prices – Biggest Weekly Jumps Fueled by a sudden escalation in Middle East conflict and concerns over major supply disruptions, Brent crude oil prices experienced one of their biggest weekly gains since 1988. Image: Deutsche Bank
FMS Investors – Biggest “Tail Risk” Concerns about geopolitical conflict have risen among FMS investors, with 33% now viewing it as the biggest “tail risk” for the global economy, primarily due to its potential negative impact on financial markets and investments. Image: BofA Global Fund Manager Survey
Oil Price History Despite ongoing conflicts in the Middle East, oil prices have not reached new highs, primarily due to weak demand and increased production. Image: BofA Global Investment Strategy
U.S. Treasury Market Depth The U.S. Treasury market depth remains very low since the Russia-Ukraine conflict. Image: Goldman Sachs Global Investment Research
Commodities – UN Food Price Index The Russia-Ukraine conflict drives food prices to record high. Image: BofA Global Investment Strategy
Commodities – Wheat Prices The COVID-19 pandemic and the Russia-Ukraine conflict push food prices to record high. Image: BofA Global Investment Strategy