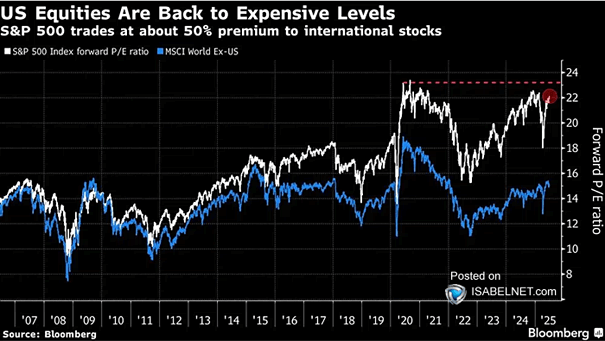
Valuation – S&P 500 12-Month Forward P/E Ratio

Valuation – S&P 500 12-Month Forward P/E Ratio The S&P 500’s forward P/E ratio of 20x places it above historical averages, reinforcing the view that current valuations are not historically cheap. Image: The Daily Shot

S&P 500 Forward P/E Ratio and Subsequent 5-Year Returns

Forward P/E Ratio and Subsequent 5-Year Annualized Returns Given current U.S. stock market valuations, investors may need to lower their expectations for equity returns over the next five years. Image: J.P. Morgan Asset Management

U.S. Tech Valuations – Forward P/E Ratio

U.S. Tech Valuations – Forward PE Ratio U.S. tech sector’s valuations have surpassed post-COVID highs. However, historical precedent suggests that these high valuations may be challenging to sustain going forward. Image: Morgan Stanley Wealth Management

Value vs. Growth – Forward P/E Ratios

Value vs. Growth – Forward P/E Ratios Value stocks still look cheap relative to growth stocks, despite the recent strength in value stocks. Image: J.P. Morgan Asset Management