Hard Data vs. Soft Data

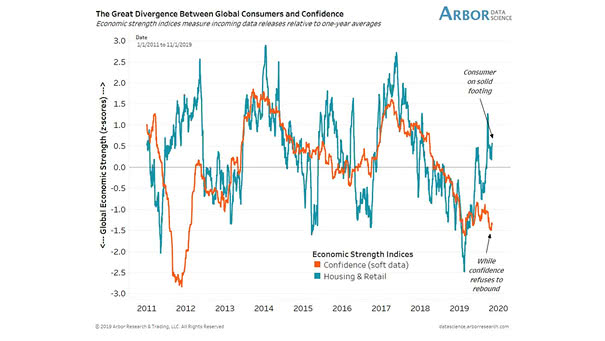
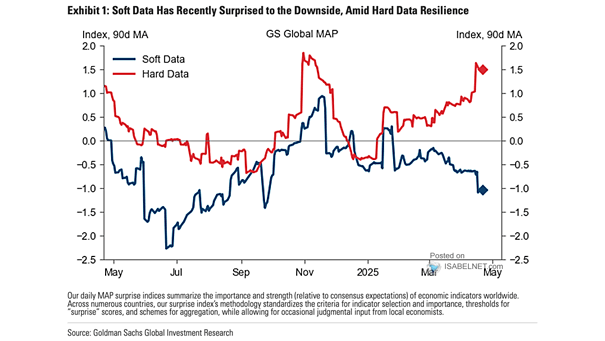
Hard Data vs. Soft Data The notable divergence between soft and hard economic data highlights the challenge of interpreting the true state of the economy. While sentiment surveys suggest caution, hard data has yet to confirm a significant slowdown. Image: Goldman Sachs Global Investment Research

Inflation, Hard Data and Soft Data

Inflation, Hard Data and Soft Data Hard data are back above long-run averages. But the chart clearly shows the divergence between hard data and soft data. Image: Arbor Research & Trading LLC

U.S. Hard Data vs. Soft Data

U.S. Hard Data vs. Soft Data U.S. hard data is improving, but the chart shows the current divergence between U.S. hard data and soft data. Image: Arbor Research & Trading LLC

U.S. ISM Manufacturing and Services Survey Data

U.S. ISM Manufacturing and Services Survey Data Economists call it a “soft recession” when factories slow but services keep humming. That resilience on the services side is what kept the U.S. out of a recession. But if services begin to crack, things could shift quickly. Image: Real Investment Advice

U.S. Current Activity Indicator

U.S. Current Activity Indicator U.S. soft data and growth signals have improved slightly, largely due to a more favorable trade policy outlook following the partial rollback of tariffs. Image: Goldman Sachs Global Investment Research

How’s the U.S. Economy Doing Now?

How’s the U.S. Economy Doing Now? The real GDP Nowcast relies on soft data such as consumer and business surveys and hard data such as retail sales and industrial production. It forecasts the growth of real GDP. At full employment, GDP returns to the level of potential GDP. If a recession were to occur today,…

U.S. Big Tech’s Capital Expenditures

U.S. Big Tech’s Capital Expenditures Tech titans Alphabet, Amazon, Meta, and Microsoft plan to spend $650 billion this year into AI data centers, chips, and infrastructure, up 60% from last year as the race for AI dominance intensifies despite mounting execution risks. Image: Bloomberg

S&P 500 vs. Liquidity Index

S&P 500 vs. Liquidity Index A slowdown in liquidity growth—particularly if combined with soft economic data—poses a short-term risk to the U.S. equity market, increasing volatility and the likelihood of price declines. Image: TS Lombard

Privacy Policy

Privacy Policy Welcome to our Privacy Policy — Your privacy is important to us. ISABELNET S.A. is located at: 51 Cite Joseph Brebsom, L-4046 Esch-sur-Alzette, GRAND DUCHY OF LUXEMBOURG (LU) (Company Registration Number: B66007) It is ISABELNET’s policy to respect your privacy regarding any information we may collect while operating our website. This Privacy Policy…