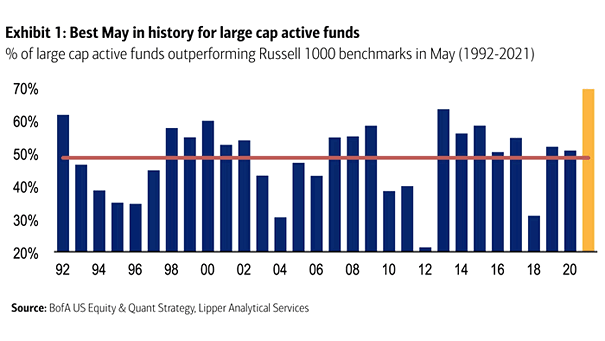
Percentage of Active Funds Beating the Benchmark
Percentage of Active Funds Beating the Benchmark The chart shows how difficult it is for most active funds to beat the benchmark over time. Image: BofA US Equity and Quant Strategy
U.S. Active Fund Managers vs. Benchmarks It is hard for active fund managers to beat their benchmarks over the long term. Image: Financial Times
Passive Over Active Funds History suggests that investor outflows from active funds are smallest after periods of high policy uncertainty. Image: Goldman Sachs Global Investment Research
Share of Passive vs. Active Equity Funds Passive equity funds should surpass active by 2022, as active equity funds exhibit persistent outflows. Image: BofA Global Investment Strategy
U.S. Domiciled Funds: Active vs. Passive as a % of Assets Under Management Active has lost for the last 10 years. Image: BofA US Equity & Quant Strategy
Flows by Year into Active vs. Passive Funds Passive has won and now accounts for 46% of all U.S. domiciled fund assets. Image: BofA US Equity & Quant Strategy
Active vs. Passive Fund Flows Strong inflows into passive funds, while active funds continue to experience outflows. Image: J.P. Morgan
Passive Equity and Bond Funds vs. Active Equity and Bond Funds The popularity of passive investing through ETFs and index mutual funds has grown significantly since 2010. Image: Financial Times
Flows into ETFs and Mutual Funds (Passive vs. Active) Mutual funds exhibit persistent outflows explained by aging and fees, while inflows into ETFs continue to rise. Image: Arbor Research & Trading LLC
U.S. Domiciled Funds: Active vs. Passive Record passive inflows suggest passive equity funds will surpass active in the coming years. Image: BofA Merrill Lynch US Equity & US Quant Strategy