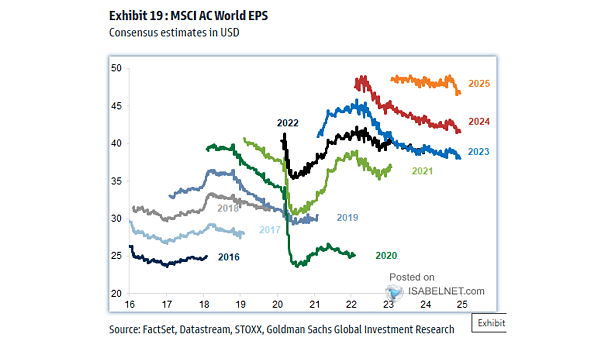
MSCI World EPS and South Korea Exports

MSCI World EPS and South Korea Exports Chart showing the quite good correlation between MSCI World EPS and South Korea exports, and suggesting this does not bode well for MSCI World EPS. Image: Nordea and Macrobond

S&P 500 Forward EPS and World Trade Growth

S&P 500 Forward EPS and World Trade Growth The chart shows a pretty good correlation between the S&P 500 forward 12-month EPS and the CPB World Trade Index. Image: Oxford Economics, Macrobond

World Semiconductor Sales and S&P 500 EPS

World Semiconductor Sales and S&P 500 EPS Tight relationship between world semiconductor sales and S&P 500 earnings per share. You may also like “Semiconductor Sales vs. Global Earnings per Share.” Image: Oxford Economics

World Tech + E-commerce vs. World ex-Tech & E-commerce

World Tech + E-commerce vs. World ex-Tech & E-commerce The secular trend in the market has been deflation (credit & tech) dominating inflation, as $100 of EPS in 1995 is now $1,500 in the technology sector, but only $425 in everything else. Image: BofA Global Investment Strategy

Valuation – MSCI World P/E

Valuation – MSCI World P/E Global equity valuations appear expensive, even based on EPS including the recovery. Image: Goldman Sachs Global Investment Research