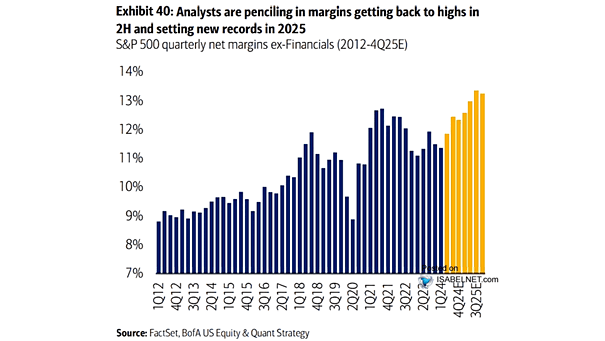
Margin Debt as Percentage of Real Disposal Personal Income

Margin Debt as Percentage of Real Disposal Personal Income Margin debt sits at a record share of real disposable income. With incomes stagnating and borrowing surging, investors look vulnerable. Markets appear calm, for now, but they can turn fast. Image: Real Investment Advice

Margin Debt as Percentage of M2 (Measure of Leverage)

Margin Debt as Percentage of M2 (Measure of Leverage) Leverage lifts returns when markets climb but reveals the weak spots when sentiment turns. Margin debt, as a share of the money supply, now stands at its highest since the dot‑com boom. Image: Real Investment Advice

FINRA Debit Balance in Securities Margin Accounts

FINRA Debit Balance in Securities Margin Accounts Leverage in margin accounts has surged since April 2025, reflecting strong market optimism. The catch is that higher leverage can turn painful fast when volatility spikes, triggering forced liquidations that weigh on the broader market. Image: Goldman Sachs Global Investment Research

S&P 500 Quarterly Net Profit Margin (ex. Financials & Utilities)

S&P 500 Quarterly Net Profit Margin (ex. Financials & Utilities) Corporate America is minting profits like never before, and with margins set to stretch even further into 2026, the bullish narrative remains intact. Image: Goldman Sachs Global Investment Research

Margin Debt Balances – YoY % Change

Margin Debt Balances – YoY % Change Margin debt on the NYSE has surged past $1.1 trillion, up nearly 40% YoY, marking one of the fastest spikes on record. Such rapid increases in borrowing, outpacing overall market gains, have often preceded market peaks. Image: Real Investment Advice

Margin Debt to U.S. Market Cap

Margin Debt to U.S. Market Cap While margin debt has been rising, its share of total U.S. market value still sits at manageable levels. That keeps leverage risks in check and suggests investors could take on more borrowing if equities keep their momentum. Image: Bloomberg

NYSE Margin Debt and S&P 500

NYSE Margin Debt and S&P 500 Margin debt on the NYSE has seen the second fastest spike on record over the past six months. Spikes in margin debt at a much faster pace than broad market returns have sometimes preceded market peaks. Image: Deutsche Bank

S&P 500 vs. Margin Debt

S&P 500 vs. Margin Debt Rising margin debt fuels rallies and reflects strong investor confidence, but once it slips below key trendlines like the 12‑month average, it flags fading risk appetite and growing market fragility. Image: Real Investment Advice

S&P 500 – Margin Debt Expansion vs. Contraction

S&P 500 – Margin Debt Expansion vs. Contraction Margin debt is soaring to levels that make some investors uneasy, flirting with the “danger zone.” For now, momentum still points higher—but a reversal would be the real red flag. Image: Topdown Charts

Margin Debt as % of U.S. Nominal GDP

Margin Debt as % of U.S. Nominal GDP NYSE margin debt exceeding $1.1 trillion, near record highs relative to nominal GDP, signals rapid investor re-leveraging and heightened volatility risk, though not necessarily implying an imminent market crash. Image: Deutsche Bank

S&P 500 and Margin Debt

S&P 500 and Margin Debt Now above $1 trillion, margin debt stands at just about 1/57th of the total U.S. equity market cap, up 35% from a year ago—still a far cry from the surges seen at past bubble highs. Market tone feels alert, not alarmed. Image: Fidelity Investments