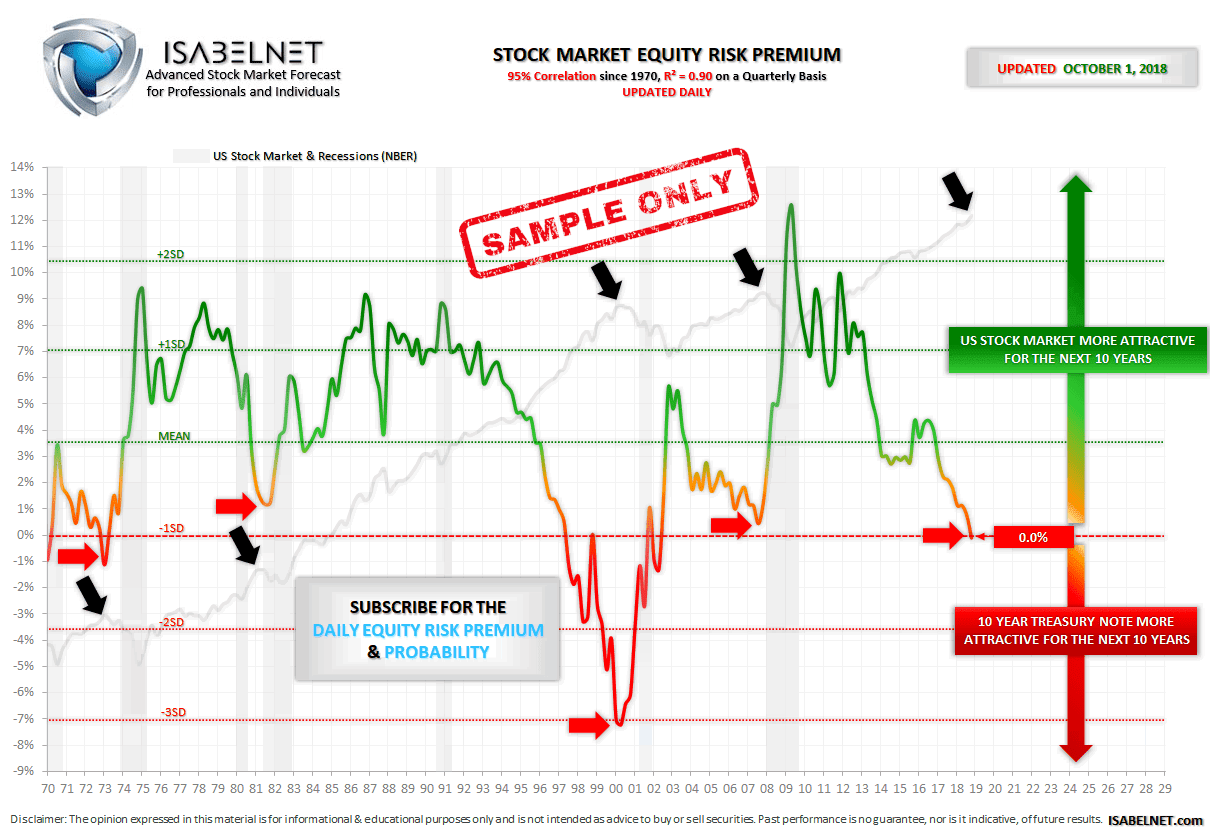
This fabulous model shows if the US stock market return for the next 10 years is more or less attractive than the 10-Year Treasury Note
The US stock market equity risk premium is the US stock market excess return for the next 10 years over the US 10-year Treasury Note.
This is the premium that investors demand to hold equities instead of Treasuries. Over long periods, this premium is close to 3.5%. What this means is that the equity risk premium should fall back toward normal over long periods.
In gray, it displays the US stock market and recessions from the National Bureau of Economic Research. The S&P 500 is certainly the best-known proxy for the US stock market because it captures 80% of the market capitalization.
When the equity risk premium is positive, then the US stock market return is more attractive for the next 10 years than the 10-Year Treasury Note.
And when the equity risk premium falls to zero or is negative, then the 10-Year Treasury Note is more attractive than the US stock market return for the next 10 years.
As an example: this advanced model was a perfect indicator with a weak equity risk premium, in 1973 during the Nifty Fifty stock bubble, in 1981 before the recession, between 1997 and 2002 during and after the internet bubble, in 2007 before the Great Recession, and finally in 2018 before the stock market crash.
Another example: this advanced model was a superb indicator with a great equity risk premium, in 1974 during the recession, in 1986, one year before the stock market crash, also known as Black Monday, in 1990 during the recession, in 2002 after the internet bubble burst, in 2009 during the Great Recession, and finally in 2010 and 2011 during the European debt crisis.
This fabulous equity risk premium model is updated daily. It shows the mean of the equity risk premium and the standard deviations.
It has a great 95% correlation with the US stock market on a quarterly basis since 1970 and an R² of 0.90. It means that 90 percent of the US stock market variance is predictable by the flows of data used.
By using this great decision support tool, you will empower yourself to make much better investment decisions.