10-Year U.S. Treasury Yield Fair Value
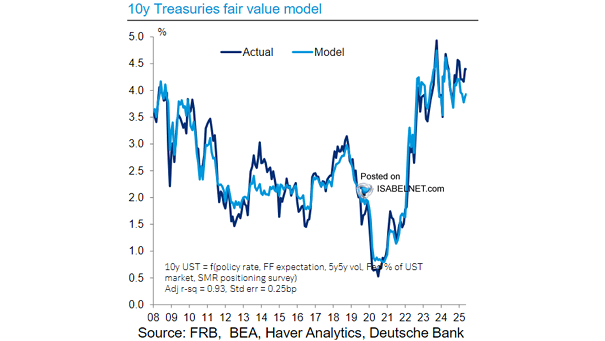
10-Year U.S. Treasury Yield Fair Value The fair value model for the 10-year U.S. Treasury yield, based on market variables, suggests a fair value close to 3.9%. Image: Deutsche Bank
10-Year U.S. Treasury Yield Fair Value The fair value model for the 10-year U.S. Treasury yield, based on market variables, suggests a fair value close to 3.9%. Image: Deutsche Bank
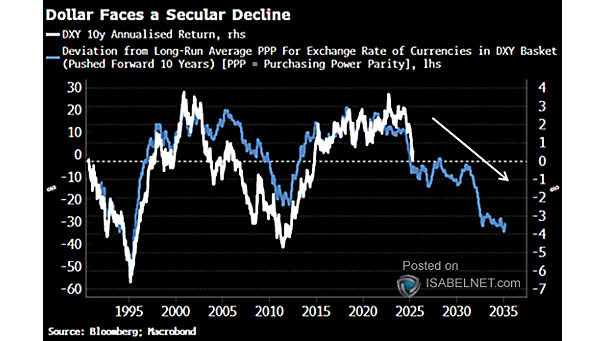
U.S. Dollar DXY Index Deviation from PPP Fair Value and Subsequent 10-Year Annualized Return By most measures, the U.S. dollar remains overvalued-even after its recent declines-and appears poised for a secular decline. Image: Bloomberg

U.S. Dollar Index and Purchasing Power Parity Fair Value According to the measure of Purchasing Power Parity fair value, the U.S. dollar remains overvalued. Image: BCA Research
S&P 500 Fair Value According to BofA, the fair value of the S&P 500 is 3,911 by year-end 2023 (bear case, based on the most bearish model). Image: BofA Global Research
U.S. 10-Year Treasury Yield and Fair Value Model How much higher could bond yields potentially go before they peak? Image: Alpine Macro
S&P 500 DDM-Implied Fair Value Goldman Sachs forecasts the U.S. 10-year Treasury yield at 1.6% by the end of 2021 and the S&P 500 to reach 4,700 (base case scenario). Image: Goldman Sachs Global Investment Research
S&P 500 “Fair Values” According to ISM Levels If the ISM drops to 50 by the end of 2021, the “fair value” of the S&P 500 would be 3730. Image: Nordea and Macrobond
Real Effective U.S. Dollar and Fair Value Is the recent weakness of the U.S. dollar the beginning of a large move? Image: Alpine Macro
Small Caps Valuation – Russell 2000 “Fair Value” Is the massive outperformance of small caps coming to an end? Image: Morgan Stanley Research
Actual and Fair Value Estimate of the S&P 500 Index Level The fair value model from J.P. Morgan sees upside for the S&P 500 in 2021. Image: J.P. Morgan
U.S. 10-Year Treasury Fair Value Adjusted for QE A potential “blue wave” could add fuel to the bear steepening in the U.S. Treasury curve. Image: Oxford Economics