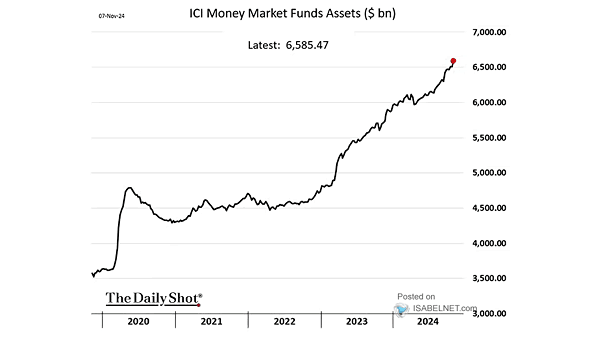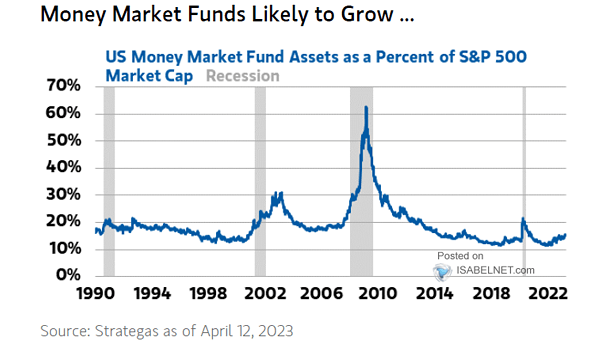
Money Market Fund Assets as a Percent of S&P 500 Market Capitalization
Money Market Fund Assets as a Percent of S&P 500 Market Capitalization Despite record levels of cash in money market funds, cash on the sidelines is not elevated relative to the S&P 500 market capitalization. In fact, the ratio of money market funds assets to S&P 500 market cap is near historic lows. Image: J.P.…