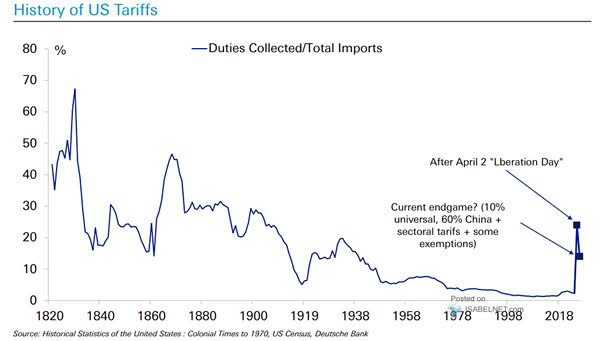
Historical U.S. Tariff Rate and Implied Rate Based on Latest Announcements
Historical U.S. Tariff Rate and Implied Rate Based on Latest Announcements If the average effective U.S. tariff rate rises to 20.7%, the economic impact could be substantial. Each 1 percentage point increase in the tariff rate is estimated to reduce economic growth by approximately 0.1 percentage point. Image: Deutsche Bank