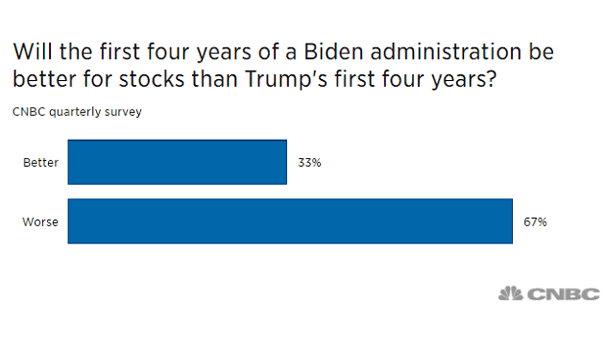
Biden vs. Trump – Who Is Better for U.S. Stocks?
Biden vs. Trump – Who Is Better for U.S. Stocks? Could the U.S. stock market see headwinds under President Biden? Image: CNBC
Biden vs. Trump – Who Is Better for U.S. Stocks? Could the U.S. stock market see headwinds under President Biden? Image: CNBC
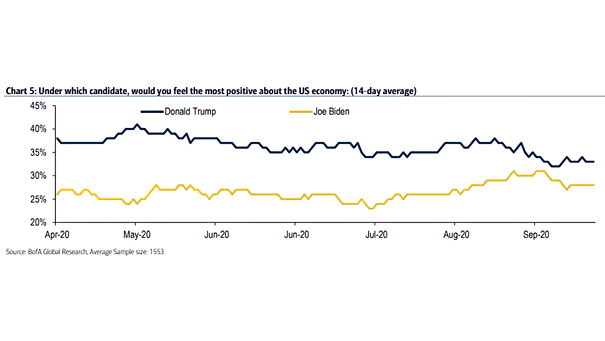
U.S. Election – Donald Trump vs. Joe Biden and the U.S. Economy Americans think that Donald Trump will be better for the U.S. economy if he is re-elected rather than if Joe Biden is elected. Image: BofA Global Research

U.S. Election – Joe Biden vs. Donald Trump and the U.S. Economy Americans believe that Donald Trump will be a little better for the U.S. economy than Joe Biden. Image: BofA Global Research
S&P 500 Returns – Obama vs. Trump Two charts comparing Obama’s vs. Trump’s stock market returns. Image: Gavekal, Macrobond
Biden-Trump Election Betting Odds As odds are rising, is Donald Trump on course to repeat 2016 win? Image: J.P. Morgan
U.S. Dollar and President Trump This chart shows the correlation between the U.S. dollar and President Trump’s approval ratings Image: TD securities
U.S. Dollar and Trump Job Approval Poll Average (Leading Indicator) This chart suggests that the U.S. dollar could rise, if it continues to track Trump’s approval rating. Image: Jeffrey Kleintop
S&P 500 under Trump vs. the Average Presidential Cycle The S&P 500 under President Donald Trump stacks up well against the average presidential cycle. Image: CNBC
Trump Tweets by Topic Is President Trump worried about impeachment? His tweets are now focused on the ‘witch hunt’ and democrats. Image: Arbor Research & Trading LLC
President Trump Tweets Contribute to Market Volatility President Trump’s tweets during his first term had a significant impact on financial markets, often contributing to increased volatility. During Trump’s second term, the dynamics appear similar. Image: Bloomberg
S&P 500 Performance by President, from Reagan to Trump For President Trump, the stock market is a scorecard. This chart shows the S&P 500 performance across different presidencies, from Reagan to Trump. Image: Deutsche Bank