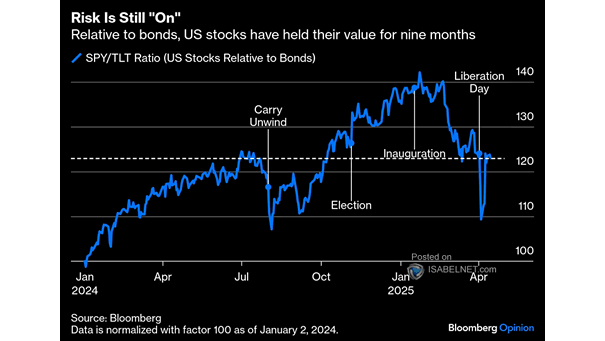
U.S. Stocks Relative to Bonds
U.S. Stocks Relative to Bonds U.S. stocks are at their strongest relative to bonds since Trump’s inauguration, supported by persistent risk appetite and the perception of U.S. market resilience amid global uncertainty. Image: Bloomberg