U.S. 10-Year – 2-Year Yield Curve
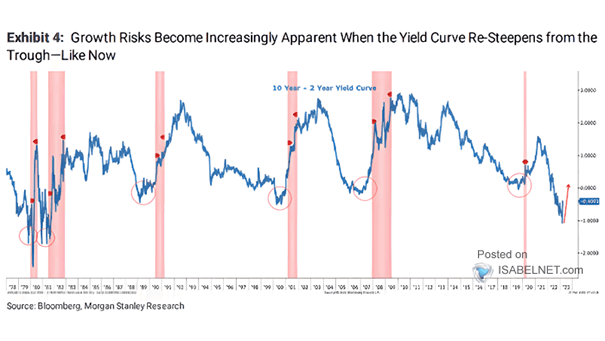
U.S. 10-Year – 2-Year Yield Curve Historically, the re-steepening of the U.S. 10Y-2Y yield curve from the trough has preceded recessions. Image: Morgan Stanley Research
U.S. 10-Year – 2-Year Yield Curve Historically, the re-steepening of the U.S. 10Y-2Y yield curve from the trough has preceded recessions. Image: Morgan Stanley Research
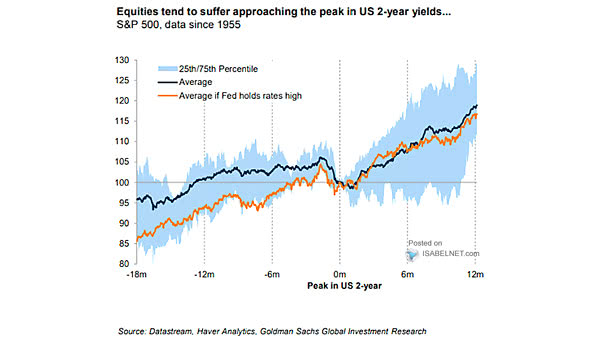
S&P 500 and Peak in U.S. 2-Year Yields Should investors expect the S&P 500 to rebound after the peak in U.S. 2-year yields? Image: Goldman Sachs Global Investment Research

U.S. 10-Year Yields and Peak in U.S. 2-Year Yields Will U.S. Treasury yields peak once the Fed finishes tightening? Image: Goldman Sachs Global Investment Research
U.S. Dollar and Peak in U.S. 2-Year Yields Will the U.S. dollar stay strong as long as the Fed remains hawkish? Image: Goldman Sachs Global Investment Research
Days from Peak in U.S. 2-Year Yield to End of Fed Hiking Cycles Will the U.S. 2-year Treasury yield peak before the end of the Fed’s hiking cycle? Image: Goldman Sachs Global Investment Research
Rates – 6-Month Change in U.S. 2-Year Yield This is the largest 6-month change in U.S. 2-year rates since mid-1994. Image: BofA Global Research
U.S. Dollar Index (DXY) vs. U.S. Minus G10 (Ex. U.S.) 2-Year Yield Rising U.S. interest rates tend to make the U.S. dollar stronger. Image: Alpine Macro
U.S./German 2-Year Yield Spread vs. U.S./Euro Foreign Exchange Rate This chart shows the Euro vs. US Dollar (EUR/USD) and how a wider U.S./German 2-year yield spread corresponds to a stronger US dollar. R² = 0.62 since 2005.
U.S. 10-Year/2-Year Yield Spread vs. Fed Funds Target Rate Interesting chart showing the U.S. 10Y-2Y yield curve steepness versus. the Fed funds target rate (inverted). Image: Credit Suisse
U.S. 10-Year/2-Year Yield Curve and Recession After the first Fed rate cut, a steepening of the U.S. 2-Year/10-Year spread could suggest a recession is coming. Image: UBS
Fed Funds vs. 2-Year U.S. Treasury Yield (Leading Indicator) The current 2-year U.S. Treasury yield, sitting below the fed funds rate, indicates that the Fed’s monetary policy is restrictive. Historically, the 2-year yield tends to lead the fed funds rate by approximately 20 weeks. Image: Bloomberg