Global Debt Levels vs. Global Bond Yields
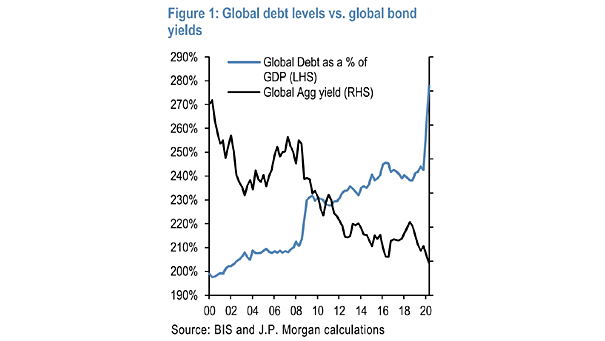
Global Debt Levels vs. Global Bond Yields Global debt is at all-time high, while global bond yields are at all-time low. Image: J.P. Morgan
Global Debt Levels vs. Global Bond Yields Global debt is at all-time high, while global bond yields are at all-time low. Image: J.P. Morgan
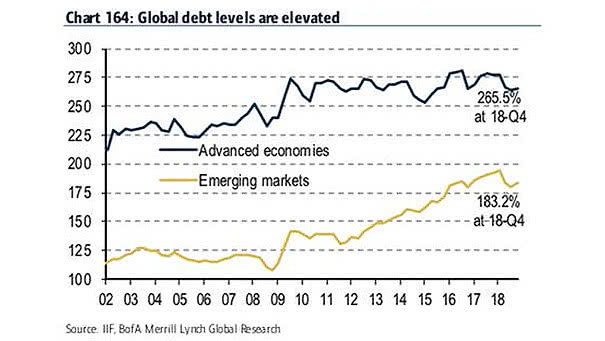
Global Debt Levels – Advanced Economies and Emerging Markets Historically, high debts create serious risks. Global debt levels have increased significantly since the Global Financial Crisis. Image: BofA Merrill Lynch Global Research

S&P 500 Cash Balances and Debt Levels During the past 12 months, non-financial S&P 500 cash balances have declined by -11% and debt levels have inflected higher by +9%. Image: Goldman Sachs Global Investment Research
U.S. Federal Debt Held by the Public The U.S. public debt has reached unprecedented levels both in absolute terms and relative to the economy, raising significant concerns about the country’s fiscal sustainability and economic future. Image: Deutsche Bank
S&P 500 – Margin Debt Expansion vs. Contraction A decline in margin debt has historically signaled impending market turbulence, as margin debt levels often reflect investor confidence and risk appetite. Image: Topdown Charts
Debt-to-GDP and 10-Year Government Bond Yield While it might seem intuitive that higher debt burdens would lead to higher yields due to increased risk, this relationship has not held true in practice. Yields are influenced by multiple economic factors, not just debt levels. Image: BCA Research
U.S. Stock Market – Margin Debt and Free Cash Balances The record surge in margin debt reflects heightened risk-taking among investors. If retail enthusiasm persists, this trend may continue, but elevated margin debt levels could amplify market volatility. Image: Real Investment Advice
GWIM Debt Holdings as % of AUM Bank of America’s private clients maintain a low debt allocation of 20%, which remains significantly below the average level. Image: BofA Global Investment Strategy
Global Government Debt Global government debt has skyrocketed since the global financial crisis, reaching its highest level in peacetime and posing significant challenges and vulnerabilities for governments and economies worldwide. Image: BofA Global Investment Strategy
U.S. Stock Market – Margin Debt Balances Could the level of margin debt in U.S. equities pose a risk to the bull market? Image: Real Investment Advice
U.S. Debt per Capita U.S. debt per capita is surging, reaching the current level of $82,000. Image: BofA Global Research