S&P 500 Index – the Cost of Waiting
S&P 500 Index – the Cost of Waiting If investors wait for the perfect moment to invest, there is always a good reason not to be invested in the U.S. stock market. Image: Real Investment Advice
ISM Manufacturing PMI vs. Mortgage Servicing Costs (Leading Indicator) Mortgage servicing costs tend to lead the U.S. ISM Manufacturing PMI by 12 months. Image: Topdown Charts
S&P 500 – YoY Change in Costs The growth rate of corporate costs is very high. Should investors expect a margin squeeze? Image: Morgan Stanley Wealth Management
Baltic Dry Index – Dry Bulk Shipping Costs The Baltic Dry Index is now down 50% since the October peak. Image: BofA Research Investment Committee
Inflation and Shipping Costs Have shipping costs finally peaked? This would be good news for inflation. Image: BCA Research
Total Real Return of $1000 Investment with Dollar Cost Average vs. S&P 500 Valuations Diversification does not always work and valuations matter. The S&P 500 can take a very long time to recover from a bear market. Image: Real Investment Advice
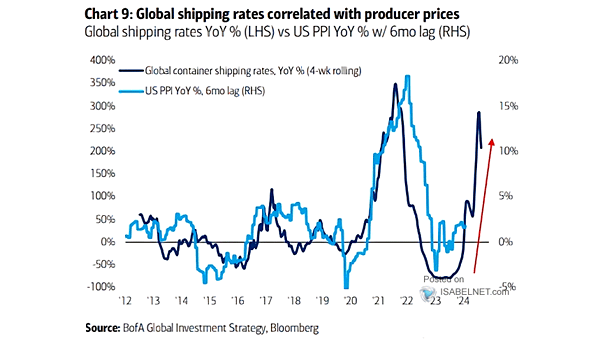
Inflation – Cost of Shipping Goods from China Container rates from China are rocketing higher. Image: BofA Global Investment Strategy
U.S. Dollar – Real Effective Exchange Rates Based on Unit Labor Costs Chart suggesting that the U.S. dollar is overvalued relative to its G7 peers. Image: Gavekal, Macrobond
Housing – U.S. Median Famility Income to Mortgage Cost This chart suggests that relative to family incomes, buying a home in the U.S. is currently quite affordable by historical standards. Image: Gavekal, Macrobond
The Cost of a Barrel of Oil in Real U.S. Dollar Terms This chart puts into perspective the real price of oil in U.S. dollar terms since 1870. U.S. oil prices turned negative for the first time in history. Image: Deutsche Bank