S&P 500 Price Target for 2026

S&P 500 Price Target for 2026 Goldman Sachs still sees steady earnings growth pushing the S&P 500 up 17% to 8,000 in 2026, even as volatility is likely to remain part of the ride. Image: Goldman Sachs Global Investment Research

S&P 500 vs. Russell 2000 – YTD Change in Price, Earnings, and Valuation

S&P 500 vs. Russell 2000 – YTD Change in Price, Earnings, and Valuation The S&P 500’s year-to-date total return has been driven entirely by earnings growth, while the Russell 2000’s advance has come roughly half from multiple expansion and half from earnings growth. Image: Goldman Sachs Global Investment Research

Forecast of Gold Prices

Forecast of Gold Prices Goldman Sachs slashed its year-end gold forecast by $500 an ounce as expectations for Fed easing in 2026 faded. The new $4,900 December target still leaves room for second-half gains. Image: Goldman Sachs Global Investment Research

Price Return in 2026

Price Return in 2026 The median stock in each region is lagging this year, with gains concentrated in a narrow group of heavyweight tech names. Image: Goldman Sachs Global Investment Research

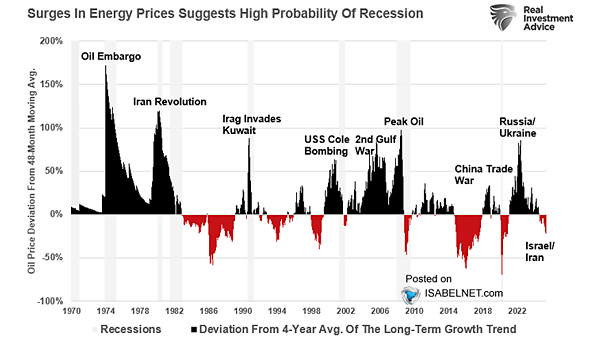
Oil Prices vs. U.S. Inflation

Oil Prices vs. U.S. Inflation When oil rises, inflation tends to follow, pushing up energy and transport costs that ripple across the economy. That dynamic often pressures equities, as margins tighten and consumers pull back. Image: Real Investment Advice

CPI Computers, Periph and Others vs. Import Price (Leading Indicator)

CPI Computers, Periph and Others vs. Import Price (Leading Indicator) AI may put upward pressure on near-term CPI, especially in computers, peripherals and related electronics, as surging demand lifts the cost of chips, memory and other key components. Image: Deutsche Bank

Retail Gasoline Price Change Between February 23 and April 27, 2026

Retail Gasoline Price Change Between February 23 and April 27, 2026 The Middle East conflict is sending fuel costs soaring across Asia, with gasoline prices in Southeast Asia up 37% since the war began. In the U.S., prices have surged 42%, a sharp rise that is hard to ignore. Image: J.P. Morgan Commodities Research

WTI Oil Prices in Real Terms

WTI Oil Prices in Real Terms The 2026 oil shock looks far less dramatic in historical terms. It still bites, just not with the same force. Once you adjust for inflation and reduced energy intensity, today’s price levels compare more favourably than in 2022. Image: Deutsche Bank

U.S. Tech – 3-Month Change in Price vs. 3-Month Change in FY2 EPS

U.S. Tech – 3-Month Change in Price vs. 3-Month Change in FY2 EPS Until recently, U.S. tech earnings and stock returns have run hand in hand. With the correlation breaking down, dips are looking more like entry points, supported by solid growth prospects tied to AI adoption. Image: Goldman Sachs Global Investment Research