Global EPS Model vs. Consensus EPS
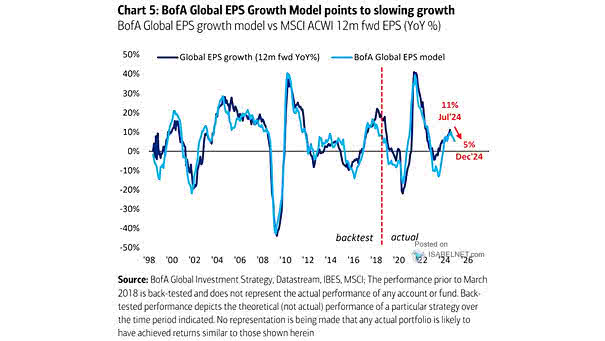
Global EPS Model vs. Consensus EPS BofA indicates a trend of slowing growth in its global earnings per share model, reflecting a shift toward a more cautious economic outlook. Image: BofA Global Investment Strategy
Global EPS Model vs. Consensus EPS BofA indicates a trend of slowing growth in its global earnings per share model, reflecting a shift toward a more cautious economic outlook. Image: BofA Global Investment Strategy
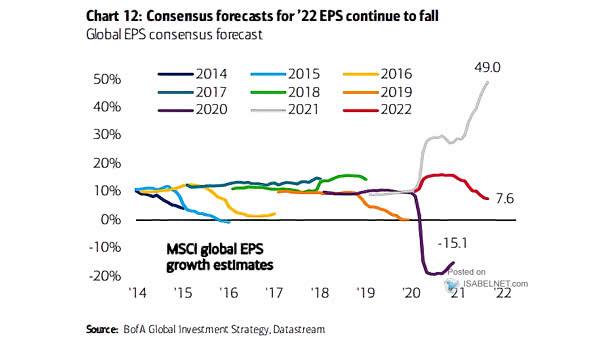
Global EPS Consensus Forecast Global EPS growth estimates for 2022 are falling. Will global stocks follow? Image: BofA Global Investment Strategy

Global EPS – Global Earnings Growth This chart highlights the strong recovery in global earnings growth. Image: Fidelity Investments
Global EPS Growth and South Korean Exports Chart suggesting that growth in South Korean exports can help forecast global EPS growth over the next 12 months. Image: BofA Global Investment Strategy
Global Profit Cycle – South Korea Exports and Global EPS Chart showing the correlation between South Korea exports and global EPS. Image: BofA Global Investment Strategy
Global Composite PMI and EPS Growth The Global Composite PMI serves as a leading indicator for EPS growth, with its trends providing insights into future corporate earnings performance. Image: J.P. Morgan
Earnings – Global Manufacturing PMI New Orders vs. World Trailing 12-Month EPS (Leading Indicator) Global manufacturing PMI new orders tend to lead world EPS growth by 12 months. Image: BofA Global Research
Estimated Impact on Consensus 2022 EPS of Global 15% Minimum Tax Rate Wall Street should not fear a global minimum corporate tax rate of 15%. Image: Goldman Sachs Global Investment Research
Rolling 10-Year Correlation of Real S&P 500 EPS Growth vs. Real U.S. and Global GDP Growth Real S&P 500 EPS growth tends to be more correlated to global than U.S. GDP growth. Image: BofA US Equity & Quant Strategy
Annualized EPS Growth Across Major Global Equity Markets Goldman Sachs expects that EPS will modestly accelerate to 6% in the U.S. next year. Image: Goldman Sachs Global Investment Research
Global Semiconductor Sales vs. MSCI World EPS Growth Chart suggesting that global semiconductor sales may have bottomed. That’s good news for global EPS growth. Image: Jeroen Blokland