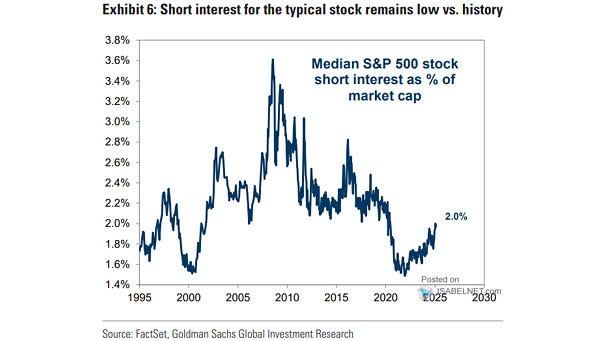
Median S&P 500 Stock Short Interest as % of Market Capitalization
Median S&P 500 Stock Short Interest as % of Market Capitalization The elevated median short interest in the S&P 500 for 2025 suggests that investors are more cautious, but it does not yet signal widespread bearishness or panic. Image: Goldman Sachs Global Investment Research