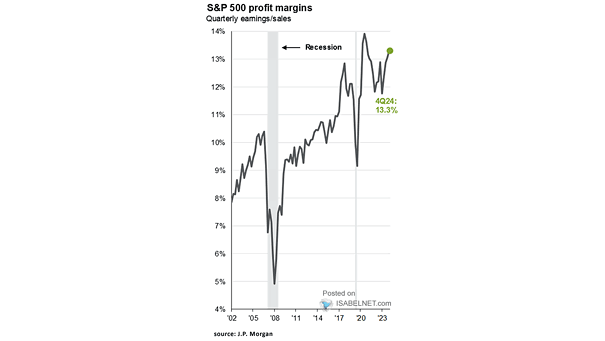
S&P 500 Quarterly Operating Earnings per Share

S&P 500 Quarterly Operating Earnings per Share Over the past eighty years, the median long-term annual growth rate in earnings for the S&P 500 is about 8%. Image: Richardson Wealth

Valuation – S&P 500 Operating Earnings Per Share

Valuation – S&P 500 Operating Earnings Per Share If companies are able to maintain their profit margins, the forward P/E ratio of the S&P 500 could fall to 20.1x by 4Q22. Image: J.P. Morgan Asset Management

S&P 500 Quarterly Operating Earnings Expectations

S&P 500 Quarterly Operating Earnings Expectations Despite the earnings squeeze, the Fed’s dovish pivot and low interest rates should continue to support the stock market. Image: Bianco Research

S&P 500 Operating Earnings / NIPA Profits and S&P 500 Returns

S&P 500 Operating Earnings / NIPA Profits and S&P 500 Returns Interesting chart suggesting that S&P500 2-year returns will be negative, as they were in the late 1990s, when S&P 500 operating earnings rose relative to NIPA profits (thanks to buybacks). Image: Oxford Economics, Macrobond

S&P 500 Operating Earnings per Share

S&P 500 Operating Earnings per Share The S&P 500 quarterly operating earnings per share are Standard & Poors consensus analyst expectations as of 30 June 2019. Picture Source: J.P. Morgan Asset Management