China’s Share in Global Exports
China’s Share in Global Exports With China leading the global economic recovery, China’s exports rose 9.9% YoY. Image: J.P. Morgan
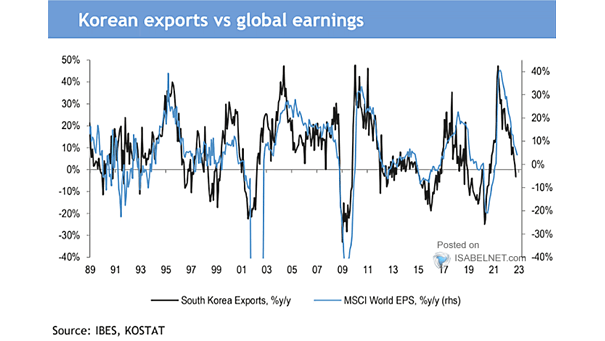
Global EPS Growth and South Korean Exports Chart suggesting that growth in South Korean exports can help forecast global EPS growth over the next 12 months. Image: BofA Global Investment Strategy
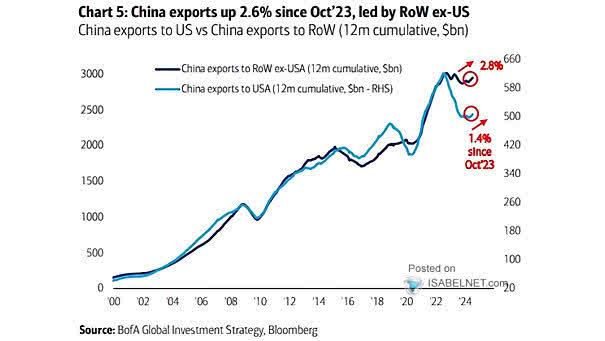
Trade Volumes – U.S. Imports from China and U.S. Exports to China The effects of the coronavirus pandemic have also negatively impacted trade volumes between the U.S. and China. Image: BofA
Taiwan’s Tech Exports vs. South Korea The Taiwan’s tech sector has trumped its South Korean peer since 2018. Image: Gavekal, Macrobond
U.S. Economy – Exports and Imports Annual Growth In May, US exports sank to 11-year low, and imports dropped as demand for goods slows. Image: Oxford Economics
Oil Exporters vs. Importers and Brent Price This chart shows the good correlation between oil exporters vs. importers and the price of Brent. Image: Goldman Sachs Global Investment Research
Global Export Restrictions in Response to Coronavirus Bans may backfire, as many countries impose export restrictions. Image: Statista
U.S. Trade and Shipment Decline (Imports – Exports) Chart showing the US trade collapse, as the coronavirus plunges the global economy into recession. Image: Bloomberg
Chinese Exports to EU and U.S. The impact on Chinese exports to the U.S. could be much worse than 2008. Image: Gavekal, Macrobond
U.S. Trade Is Sharply Slowing (Imports – Exports) This chart shows the U.S. trade collapse, as the coronavirus plunges the global economy into recession. Image: Bloomberg