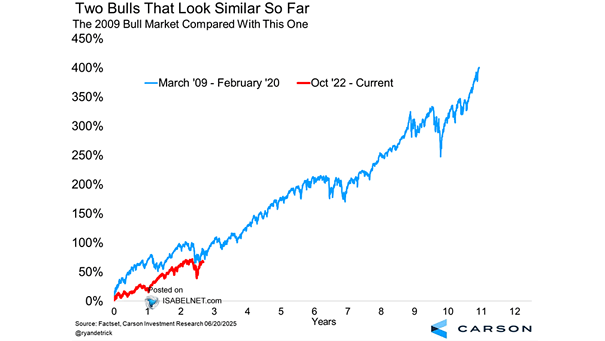
The 2009 S&P 500 Bull Market Compared With This One
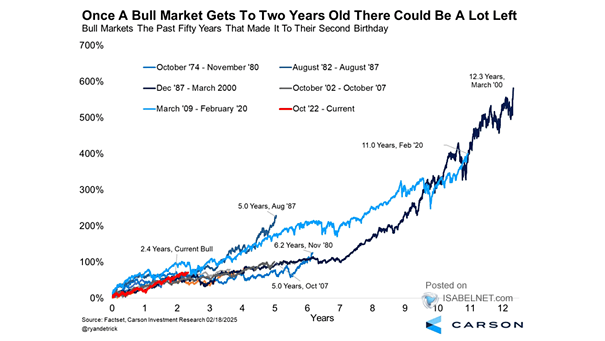
The 2009 S&P 500 Bull Market Compared With This One Near-bear market corrections in the middle of year three are common in long bull markets, reflecting normal consolidation phases within a longer-term upward trend, as seen in the 2009 bull market and the ongoing one. Image: Carson Investment Research