S&P 500 vs. Global Money Supply
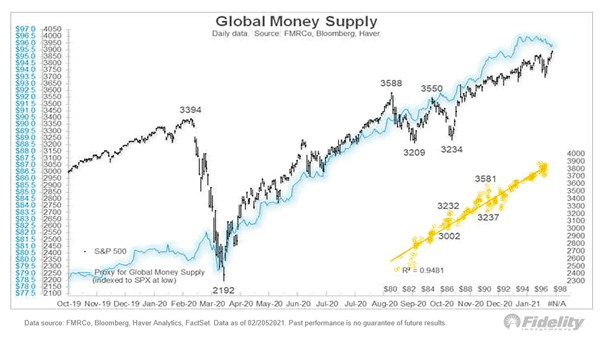
S&P 500 vs. Global Money Supply More global stimulus could be bullish for stocks, as global money supply growth tends to push U.S. equities higher. Image: Fidelity Investments
S&P 500 vs. Global Money Supply More global stimulus could be bullish for stocks, as global money supply growth tends to push U.S. equities higher. Image: Fidelity Investments
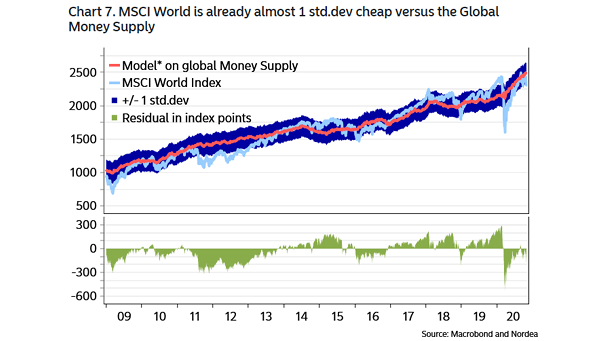
Global Money Supply and MSCI World Index Global equities are around 1 standard devation vs. global money supply. It could be bullish for stocks, as global money supply growth tends to push equities higher. Image: Nordea and Macrobond

S&P 500 and Global Money Supply Chart suggesting that global money supply tends to push U.S. equities higher. Image: Fidelity Investments
Bitcoin Market Capitalization and Global M2 Money Supply Bitcoin could fall if global M2 money supply continues to slow. Image: Morgan Stanley Research
Federal Reserve Money Supply M2 Leads Global Manufacturing PMI Chart suggesting that the Federal Reserve money supply M2 leads global manufacturing PMI by 18 months. Image: Nordea and Macrobond
S&P 500 Index vs. M2 Money Supply Global M2 money supply growth has a significant impact on U.S. stocks. Image: Morgan Stanley Wealth Management
M2 Money Supply Growth Is the growth in money supply the solution to boost economic growth? Image: J.P. Morgan US Equity Strategy & Global Quantitative Research
U.S. Money Supply M2 Growth U.S. money supply M2 growth is going parabolic compared to the global financial crisis. Image: Morgan Stanley Research
M1 Money Supply vs. Yield Curve and Recessions Great chart showing the correlation between M1 money supply and the yield curve. The key factor for inverted yield curves is tight money. Image: BofA Merrill Lynch Global Research
S&P 500 Index vs. Global M1 Liquidity Another good correlation between the S&P 500 Index and global M1 liquidity, while the Fed plans to stop quantitative tightening. The money supply M1 is the amount of effective money in the economy. Image: Nordea and Macrobond