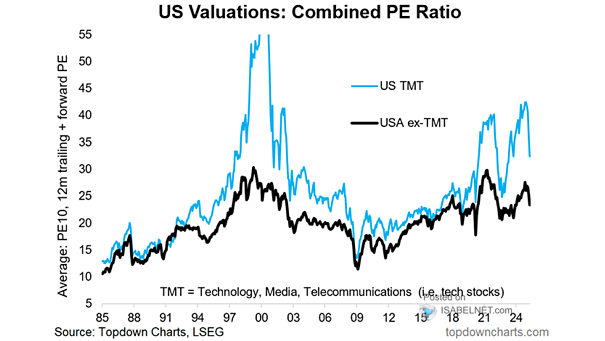
Stock Market Performance
Stock Market Performance Is it the end of the web 2.0 bubble? Image: BCA Research
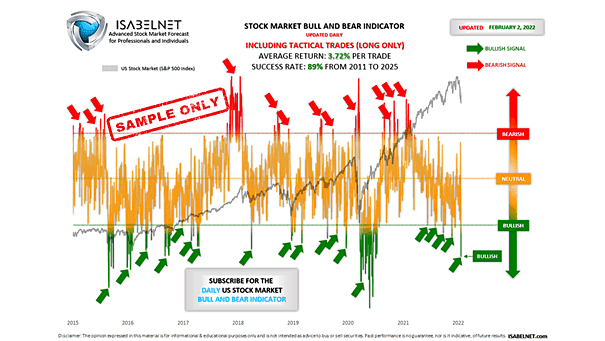
U.S. Stock Market Bull and Bear Indicator Using multiple financial data, this great model helps investors navigate through different market conditions. It suggests whether the U.S. stock market tendency is bullish, bearish or neutral. It is a contrarian indicator. A bullish signal suggests that the U.S. stock market may go up, while a bearish signal…
U.S. Stock Market – Nifty Fifty Price Returns Will the U.S. stock market be “dead” money over the next 10 years? Image: BofA Research Investment Committee
Brent Crude Oil and Saudi Arabia Stock Market (Leading Indicator) Will oil prices remain high as global demand for oil continues to rise? Image: BofA Global Investment Strategy
Stock Market Strength vs. Volatility 2022 starts to smell like 2008. Are U.S. stocks in a secular bear market? Image: Willie Delwiche
S&P 500 Drawdown – Geopolitical Events and Stock Market Reactions Historically, the impact of geopolitical events on U.S. stocks has tended to be short-lived. Image: LPL Research
U.S. Stock Market – Margin Debt Balances Could the level of margin debt in U.S. equities pose a risk to the bull market? Image: Real Investment Advice
U.S. Stock Market Valuation – Cape Ratio Is the U.S. stock market expensive today? Well, the CAPE ratio is just the second highest in over 100 years. Image: Real Investment Advice
Stock Market Breadth – NYSE Stocks Above 200-DMA and S&P 500 Price Relative to 200-DMA Stock market breadth has worsened significantly over the last months. Image: Morgan Stanley Wealth Management
U.S. Stock Market Leverage / S&P 500 Market Capitalization U.S. stock market leverage as a percent of S&P 500 market capitalization continues to rise. Is it time for investors to be cautious? Image: Topdown Charts