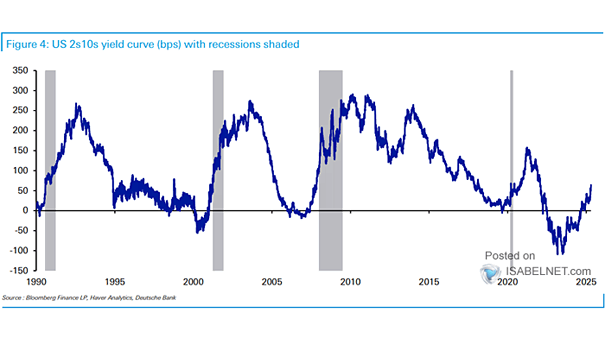
U.S. 10Y-2Y Yield Curve
U.S. 10Y-2Y Yield Curve Slope The U.S. 2s10s yield curve has inverted again, reflecting investor sentiment and expectations about future economic conditions. Image: The Daily Shot
U.S. 10Y-2Y Yield Curve The recent un-inversion of the 2s10s Treasury yield curve may indicate a positive outlook for U.S. stocks, especially if economic stability and growth persist. Image: J.P. Morgan
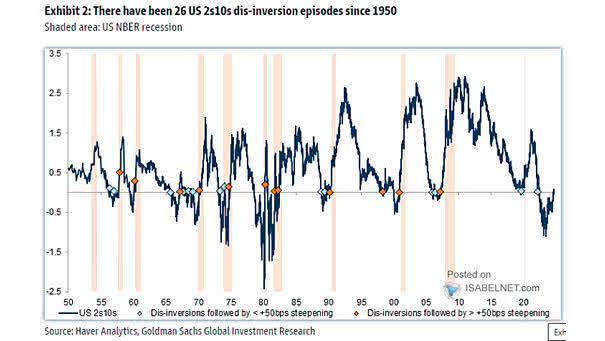
U.S. 10Y-2Y Yield Curve and Recessions When a recession is avoided, an un-inversion in the 2s10s U.S. Treasury yield curve may suggest a favorable outlook for U.S. stocks. Image: Goldman Sachs Global Investment Research
Consecutive Trading Days of Inverted 10Y-2Y U.S. Treasury Yield Curve The anticipation of Fed easing is being driven by the aging of yield curve inversion. Market participants are expecting the Fed to cut rates in order to stimulate economic growth and prevent a potential recession. Image: Morgan Stanley Wealth Management
U.S. 10Y-2Y Yield Curve vs. Recessionary Bear Market Lows Historically, a steepening inverted US 10Y-2Y yield curve tends to precede recessionary bear market lows. Image: BofA Research Investment Committee
U.S. 10Y-2Y Yield Curve and Initial Jobless Claims A steepening yield curve tends to occur when jobless claims surge. Image: BofA Global Investment Strategy
U.S. Unemployment Rate vs. U.S. 10Y-2Y Yield Curve A steepening U.S. yield curve has preceded recessions. Will the U.S. unemployment rate start to rise by the end of 2023? Image: Topdown Charts
U.S. Dollar (Inverted) vs. 10Y-2Y U.S. Treasury Yield Curve Could the U.S. dollar increase the risk of recession in the United States? Image: Morgan Stanley Wealth Management
S&P 500 Index and 10Y-2Y Yield Curve Less Than 0.25% Historically, the inversion of the 10Y-2Y yield curve is not an immediate sell signal for U.S. stocks. Image: MarketDesk Research
Yield Curve – U.S. Equity Returns in the 12-Months Following the First 10Y-2Y Inversion in Each Cycle Will the S&P 500 hit a new record high this year, despite the 10Y-2Y inverted yield curve? Image: J.P. Morgan
S&P 500 Returns Following 10Y-2Y Yield Curve Inversions The S&P 500 typically rises in the 12 and 24 months following the 10Y-2Y yield curve inversion. Image: Goldman Sachs Global Investment Research