German Stocks vs. Japanese Stocks
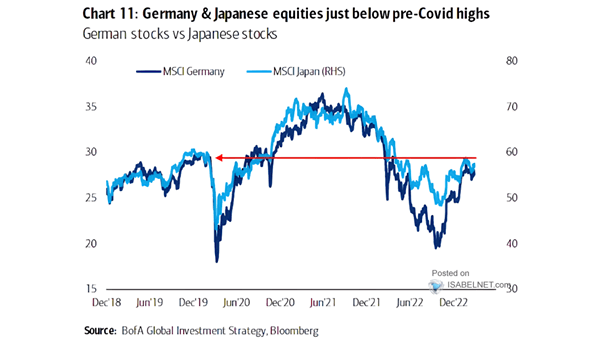
German Stocks vs. Japanese Stocks Germany and Japanese equities remain below pre-COVID highs. Image: BofA Global Investment Strategy
German Stocks vs. Japanese Stocks Germany and Japanese equities remain below pre-COVID highs. Image: BofA Global Investment Strategy
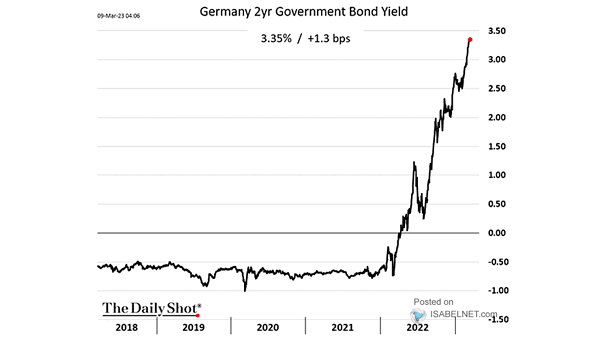
Germany 2-Year Government Bond Yield The German 2-year government bond yield, considered to be the most sensitive to European Central Bank (ECB) policy rate expectations, continues to rise. Image: The Daily Shot

Germany 2-Year Government Bond Yield The German 2-year government bond yield, considered to be the most sensitive to European Central Bank (ECB) policy rate expectations, hit a 14-year high. Image: BofA Global Investment Strategy
Energy Crisis – Germany 2-Year Asset Swap Spreads Could the Germany energy crisis turn into a deep recession? Image: BofA Global Investment Strategy
Inflation – Germany CPI YoY Has inflation in Germany peaked? Image: BofA Global Investment Strategy
Germany Foreign Trade Balance Germany recorded its first trade deficit in goods since 1991. Could the euro fall further? Image: BofA Global Investment Strategy
Inflation – German PPI YoY German PPI jumped 25.9% YoY in February, the highest since 1949. Image: BofA Global Investment Strategy
Yield Curve – 2Y/10Y U.S. Treasury Yield Spread and 2Y/10Y German Treasury Yield Spread The U.S. and German yield curves are decoupling, suggesting a slower economic activity in the United States. Image: Morgan Stanley Wealth Management
Stocks – GRANOLAS Dividend Yield and German 10-Year Bond Yield Europe does not have the FAAMGs, but it has the GRANOLAS (Glaxosmithkline, Roche, ASML, Nestle, Novartis, Novo Nordisk, L’Oreal, LVMH, Astrazeneca, SAP and Sanofi). Image: Goldman Sachs Global Investment Research
Real Yield – Five-Year Government Bonds, U.S. and Germany Real rate convergence helps explain the weakness of the U.S. dollar. Image: Morgan Stanley Wealth Management
China Credit Impulse and Germany PMI (Leading Indicator) China credit impulse tends to lead Germany PMI by 6 months. Image: Scotiabank GBM Portfolio Strategy