Monthly U.S. Equity Mutual Fund and ETF Flows
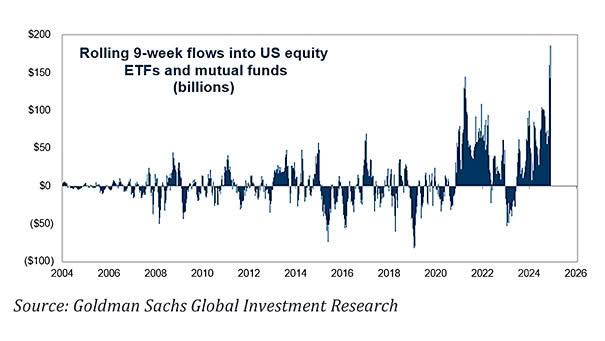
Monthly U.S. Equity Mutual Fund and ETF Flows Recently, U.S. equity fund flows have been weak, with sustained outflows driven by trade policy uncertainty and cautious investor sentiment. Image: Goldman Sachs Global Investment Research