Cass Freight Index and U.S. GDP
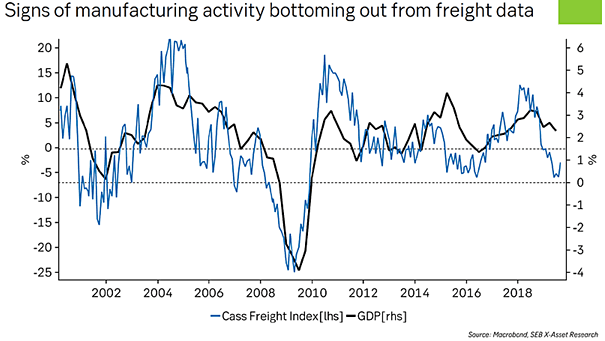
Cass Freight Index and U.S. GDP The Cass Freight Index suggests first signs of manufacturing activity bottoming out. Image: Macronond, SEB X-Asset Research
Cass Freight Index and U.S. GDP The Cass Freight Index suggests first signs of manufacturing activity bottoming out. Image: Macronond, SEB X-Asset Research
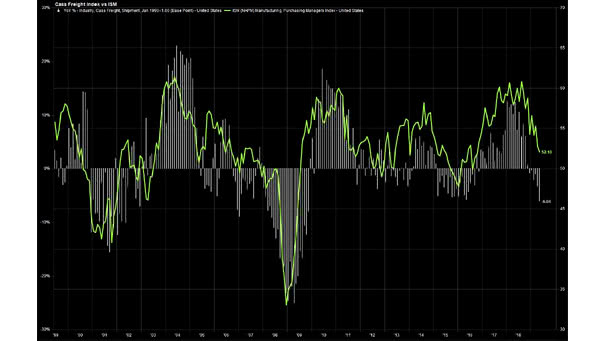
ISM Manufacturing Index vs. Cass Freight Index The Cass Freight Index (white bar chart) is a measure of monthly North American freight activity. It suggests that the ISM Manufacturing Index (green line) could go lower if the U.S. economic slowdown persists. Image: Greg S.

Inflation – U.S. CPI YoY and Cass Freight Shipments Index YoY (Leading Indicator) The Cass Freight Shipments Index suggests lower U.S. inflation in the second half of 2022. Image: Fundstrat Global Advisors, LLC
Cass Freight Shipments Index (6ma) vs. U.S. GDP The chart shows the Cass Freight Shipments Index (6-month average). It suggests a weakness in U.S. GDP in 3Q19. The Cass Freight Shipments Index is a relative good predictive indicator of the U.S. economy. You may also like “ISM Manufacturing Index vs. Cass Freight Index.” Image: Macro…
Cass Freight Shipments Index vs. U.S. GDP The Cass Freight Shipments Index is a relative good predictive indicator of the U.S. economy. It suggests a weakness in U.S. GDP in Q2 2019. The Cass Freight Index is a measure of monthly North American freight activity. You may also like “ISM Manufacturing Index vs. Cass Freight Index.”…