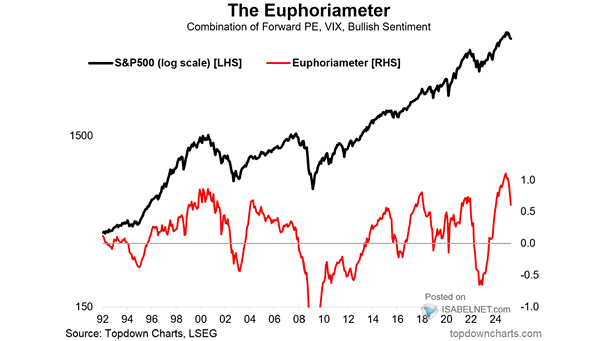
U.S. Stock Market Bull and Bear Indicator

U.S. Stock Market Bull and Bear Indicator Using multiple financial data, this great model helps investors navigate through different market conditions. It suggests whether the U.S. stock market tendency is bullish, bearish or neutral. It is a contrarian indicator. A bullish signal suggests that the U.S. stock market may go up, while a bearish signal…

Bullish Percent Index vs. S&P 500 Index

Bullish Percent Index vs. S&P 500 Index When U.S. stocks show low readings on bullish buy signals, usually below 40, it is often a favorable time to consider purchasing U.S. equities, as this tends to align with near-term market bottoms. Image: Real Investment Advice

Sentiment – Net Bullish Ratio vs. S&P 500 Index

Sentiment – Net Bullish Ratio vs. S&P 500 Index In light of the lack of optimism observed among both retail and professional investors, could this sentiment potentially serve as a catalyst for an year-end rally for the S&P 500? Image: Real Investment Advice

AAII U.S. Investor Sentiment Bull – Bear Spread

AAII U.S. Investor Sentiment Bull – Bear Spread The AAII U.S. investor sentiment bull – bear spread remains in negative territory, indicating a prevailing pessimistic outlook among AAII U.S. investors. Image: The Daily Shot

Structural Bull and Bear Markets

Structural Bull and Bear Markets Structural bear markets can be very painful for investors, as they can lead to prolonged periods of market decline and economic hardship. Image: Morgan Stanley Wealth Management