Return on Equity (ROE) : S&P 500 vs. MSCI World ex. U.S.
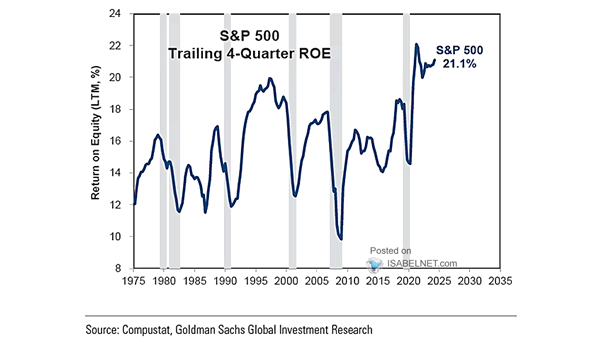
Return on Equity (ROE) : S&P 500 vs. MSCI World ex. U.S. U.S. stocks have significantly outperformed their global peers in recent years, driven by the superior return-on-equity of American companies—a key factor reinforcing the structural advantages of the U.S. market. Image: Goldman Sachs Global Investment Research