Stocks – MSCI Europe Value vs. Growth and 10-Year UST Yield
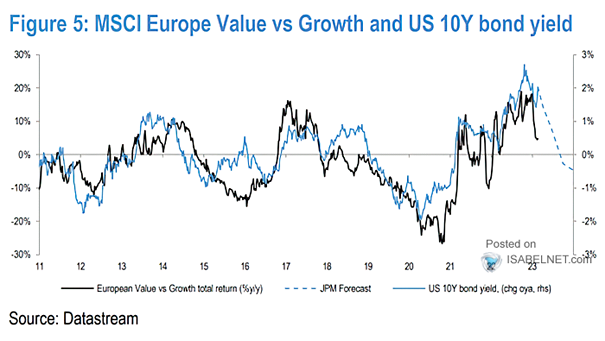
Stocks – MSCI Europe Value vs. Growth and 10-Year UST Yield Will European value stocks underperform European growth stocks in the second half of 2023? Image: J.P. Morgan
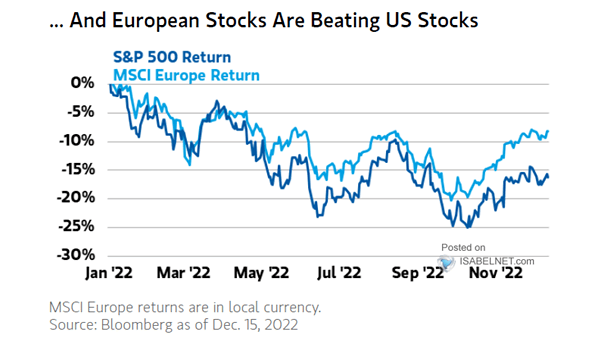
Performance – S&P 500 Return vs. MSCI Europe Return Will European stocks outperform U.S. stocks in 2023? Image: Morgan Stanley Wealth Management
Valuation – MSCI Europe 12-Month Forward P/E Valuation is back to pre-pandemic levels for European stocks. Image: Deutsche Bank Asset Allocation
European Stocks – MSCI Europe Index Two-Year Forward P/E Premium to MSCI All Country Worl Index European stocks remain cheap relative to their global peers. Image: Morgan Stanley Wealth Management
Performance – MSCI Europe vs. MSCI ACWI and MSCI World Value vs. Growth Chart suggesting that Europe’s relative performance vs. MSCI ACWI seems similar to that of Value vs. Growth. Image: Morgan Stanley Research
Relative Performance MSCI Europe vs. MSCI USA The relative performance of European stocks vs. the U.S. is at its lowest level in 50 years. Will this year be Europe’s time to outperform? Image: Legg Mason
MSCI Europe Relative to S&P 500 The relative range between the MSCI Europe Index and the S&P 500 has been broken since the European financial crisis. Since 2011, European equities have underperformed the U.S. at a -5.5% annual rate. Image: Deutsche Bank Global Research
MSCI Europe P/E and U.S. Nominal 10-Year Yield Chart showing how nominal yields usually affect stock market valuation. Image: Barclays Research
European Stocks and MSCI U.S. – Cyclically Adjusted Price-Earnings Ratio (CAPE) Why are U.S. equities more expensive than European stocks? Image: Financial Times
European Stocks and MSCI World Will European stocks continue to outperform global equities? Image: Financial Times