S&P 500 Free Cash Flow
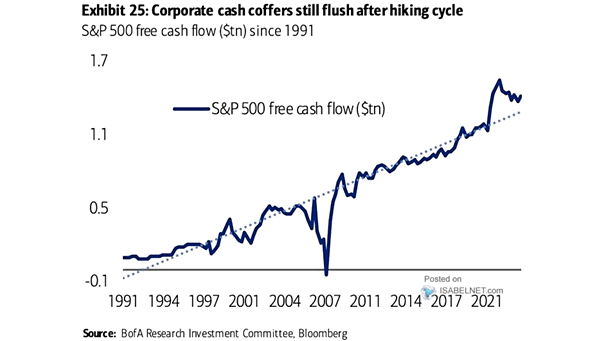
S&P 500 Free Cash Flow Despite a decline, the S&P 500 free cash flow remains higher than the historical trend, even during the current hiking cycle. Image: BofA Research Investment Committee
S&P 500 Free Cash Flow Despite a decline, the S&P 500 free cash flow remains higher than the historical trend, even during the current hiking cycle. Image: BofA Research Investment Committee
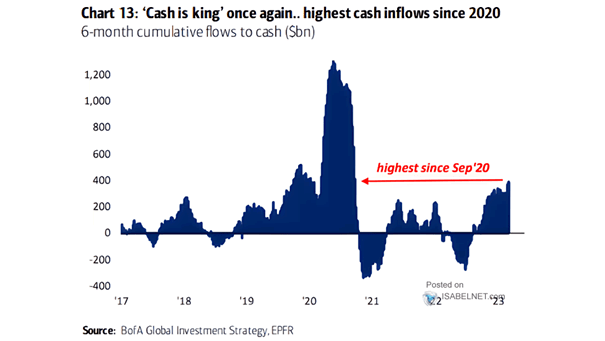
Cash Flows Will flows into cash continue to be strong as rates rise? Image: BofA Global Investment Strategy

S&P 500 Index Operating Cash Flow as a Percent of Market Capitalization Market fragility remains elevated. Cash flow as a percent of market cap is close to the dotcom bubble low. Image: Morgan Stanley Wealth Management
Net Debt of Nonfinancial Corporations Relative to Cash Flow Companies have significant cash flow to cover their debt obligations. Image: LPL Research
Free Cash Flow Margin for S&P 500 and Tech Sector The free cash flow margin for the tech sector has risen from less than 5% in the aftermath of the Internet bubble to more than 23% today. Image: J.P. Morgan Asset Management
GWIM Cash Flows This chart shows the largest cash outflow from BofA’s private clients since April 2019, while there has been a lot of cash inflow this year. Image: BofA Global Investment Strategy
ISM Manufacturing Index vs. S&P 500 Cash Flow Chart showing the correlation between S&P 500 cash flow and the ISM Manufacturing Index. Image: Raoul Pal
Shareholder Return vs. Free Cash Flow Thanks to low interest rates, shareholder return has exceeded free cash flow levels again. U.S. companies cannot spend more than they earn indefinitely. Image: Goldman Sachs Global Investment Research
Dividends and Buybacks vs. Free Cash Flow Dividends and buybacks have exceeded free cash flow levels again, thanks to low interest rates. But companies cannot spend more than they earn forever. Image: Capital Group
Cumulative Quarterly Inflow to Cash Cash is making a strong comeback as interest rates rise. Image: BofA Global Investment Strategy