Sentiment – Risk Appetite and Expected U.S. Equity Market Performance
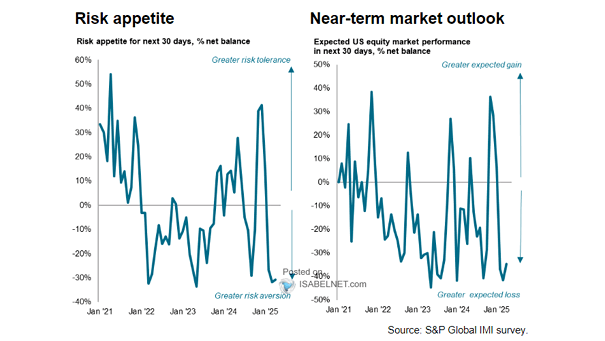
Sentiment – Risk Appetite and Expected U.S. Equity Market Performance U.S. equity investors remain highly risk-averse in June 2025, with bearish short-term return expectations, largely driven by political and macroeconomic uncertainties. Image: S&P Global Market Intelligence