U.S. Stock Market Bull and Bear Indicator

U.S. Stock Market Bull and Bear Indicator Using multiple financial data, this great model helps investors navigate through different market conditions. It suggests whether the U.S. stock market tendency is bullish, bearish or neutral. It is a contrarian indicator. A bullish signal suggests that the U.S. stock market may go up, while a bearish signal…

1987 Market Crash – DXY Dollar Index and 10-Year UST Yield

1987 Market Crash – DXY Dollar Index and 10-Year UST Yield Bond yields rarely rise while the dollar falls, as higher yields usually boost currency appeal. This unusual trend signals waning confidence, similar to the pattern seen before the 1987 Black Monday crash. Image: Bloomberg

Investor Sentiment – U.S. Market Greed/Fear Index

Investor Sentiment – U.S. Market Greed/Fear Index The Fear & Greed Index currently stands at 45.35, signaling a neutral mood among investors—neither dominated by fear nor greed. Image: Real Investment Advice

Different Market Sentiment Indicators

Different Market Sentiment Indicators By destabilizing markets and amplifying recession fears, Trump’s tariffs injected systemic risks into global trade, leading to dramatic shifts in investor sentiment and heightened market volatility. Image: Goldman Sachs Global Investment Research

Indexed S&P 500 Return – Market Hours vs. Overnight

Indexed S&P 500 Return – Market Hours vs. Overnight Overnight trading sessions account for almost all of the S&P 500’s recent downturn, overshadowing activity during normal U.S. trading hours. Image: Deutsche Bank Asset Allocation

Ownership Breakdown of the U.S. Equity Market

Ownership Breakdown of the U.S. Equity Market (Share of Corporate Equity Market) U.S. households own 38% of the U.S. equity market, demonstrating strong confidence in stocks. However, stock ownership is highly concentrated, with the wealthiest 10% holding approximately 90% of all household-owned equities. Image: Goldman Sachs Global Investment Research

S&P 500 Corrections and Bear Markets Since World War II

S&P 500 Corrections and Bear Markets Since World War II Corrections and bear markets, while inevitable and uncomfortable, often reset valuations—providing long-term investors a chance to reevaluate holdings and build positions at attractive levels. Image: Carson Investment Research

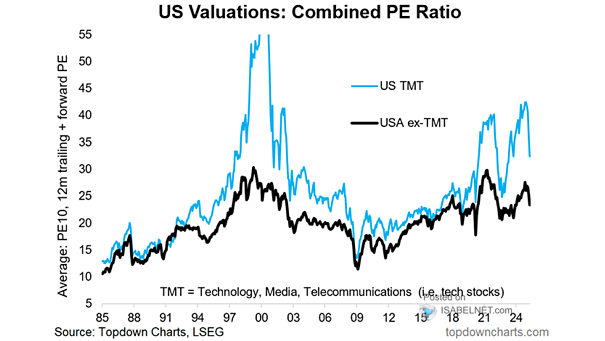
U.S. Stock Market Valuations – Combined P/E Ratio

U.S. Stock Market Valuations – Combined P/E Ratio High P/E ratios in U.S. tech stocks are a double-edged sword: they reflect both the sector’s growth potential and the risks of overvaluation driven by investor optimism. Image: Topdown Charts

Global Market Implied Equity Risk Premiums

Global Market Implied Equity Risk Premiums The current low U.S. equity risk premium highlights a difficult investment climate, with investors potentially undercompensated for the risks of equity investing. Image: Goldman Sachs Global Investment Research