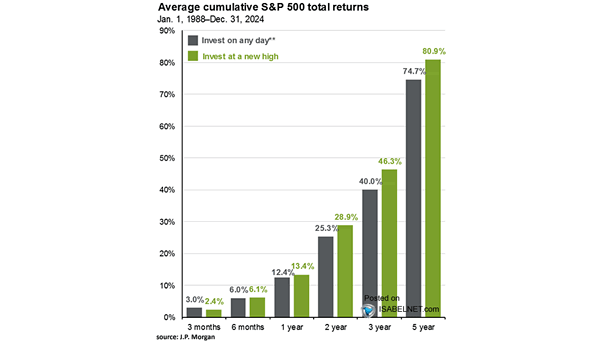
U.S. Stocks – NYSE + NASDAQ New Highs and New Lows
U.S. Stocks – NYSE + NASDAQ New Highs and New Lows It is difficult to have a bull market as long as there are more new lows than new highs. Image: All Star Charts
Global Equities – Countries Making 52-Week New Highs Should investors remain cautious on global equities? Image: Topdown Charts
S&P 500 – Number of Months per Year to Make a New High This is only the second time in history that the S&P 500 Index has made a new high every single month. Image: LPL Research
S&P 500 Future Returns After 7 New Highs in a Row Historically, after seven consecutive new all-time highs, it tends to be bullish for the S&P 500 Index over the next 12 months. Image: LPL Research
Returns After Long Streaks Without A New High, Yet Within 1% Of A New High Whole Time Experienced stock traders tend to never short a dull market. Image: LPL Research
MSCI ACWI and Number of Countries Reporting a New High in Daily Coronavirus Cases The correlation between the MSCI AWCI and new high in daily coronavirus cases (inverted) suggests continued recovery as the coronavirus pandemic fades out. Image: BofA Global Research
VIX Level and S&P 500 New Highs The VIX level when the S&P 500 reached new highs for the first time is rising. Image: Goldman Sachs Global Investment Research
S&P 500 New Highs Since 1950, November 14 has the most S&P 500 new highs ever at 11. Image: Ryan Detrick, LPL Financial LLC
S&P 500 Index Returns After Fed Rate Cuts Near New Highs The adage of “don’t fight the Fed” may be too simplistic, but usually, the market doesn’t care too much about other things, as long as the Fed stays dovish. Image: LPL Research
New S&P 500 Index All-Time Highs Per Year This year has the second most new highs ever. New all-time highs can last more than 10 years and tend to occur in clusters. Image: LPL Research